Quantcast
Channel: Netflix TechBlog - Medium
Viewing all 491 articles
Browse latest View live

Distributed delay queues based on Dynomite

$
0
0
Netflix’s Content Platform Engineering runs a number of business processes which are driven by asynchronous orchestration of micro-services based tasks, and queues form an integral part of the orchestration layer amongst these services.   

Few examples of these processes are:
  • IMF based content ingest from our partners
  • Process of setting up new titles within Netflix
  • Content Ingest, encode and deployment to CDN

Traditionally, we have been using a Cassandra based queue recipe along with Zookeeper for distributed locks, since Cassandra is the de facto storage engine at Netflix. Using Cassandra for queue like data structure is a known anti-pattern, also using a global lock on queue while polling, limits the amount of concurrency on the consumer side as the lock ensures only one consumer can poll from the queue at a time.  This can be addressed a bit by sharding the queue but the concurrency is still limited within the shard.  As we started to build out a new orchestration engine, we looked at Dynomite for handling the task queues.  

We wanted the following in the queue recipe:
  1. Distributed
  2. No external locks (e.g. Zookeeper locks)
  3. Highly concurrent
  4. At-least-once delivery semantics
  5. No strict FIFO
  6. Delayed queue (message is not taken out of the queue until some time in the future)
  7. Priorities within the shard
The queue recipe described here is used to build a message broker server that exposes various operations (push, poll, ack etc.) via REST endpoints and can potentially be exposed by other transports (e.g. gRPC).  Today, we are open sourcing the queue recipe.

Using Dynomite & Redis for building queues

Dynomite is a generic dynamo implementation that can be used with many different key-value pair storage engines. Currently, it provides support for the Redis Serialization Protocol (RESP) and Memcached write protocol. We chose Dynomite for its performance, multi-datacenter replication and high availability. Moreover, Dynomite provides sharding, and pluggable data storage engines, allowing us to scale vertically or horizontally as our data needs increase.

Why Redis?

We chose to build the queues using Redis as a storage engine for Dynomite.
  1. Redis architecture lends nicely to a queuing design by providing data structures required for building queues. Moreover, Redis in memory design provides superior performance (low latency).  
  2. Dynomite, on top of Redis, provides high availability, peer-to-peer replication and required semantics around consistency (DC_SAFE_QUORUM) for building queues in a distributed cluster.

Queue Recipe

A queue is stored as a sorted set (ZADD, ZRANGE etc. operations) within Redis.  Redis sorts the members in a sorted set using the provided score.  When storing an element in the queue, the score is computed as a function of the message priority and timeout (for timed queues).  

Push &  Pop Using Redis Primitives

The following sequence describes the high level operations used to push/poll messages into the system.  For each queue three set of Redis data structures are maintained:


  1. A Sorted Set containing queued elements by score.
  2. A Hash set that contains message payload, with key as message ID.
  3. A Sorted Set containing messages consumed by client but yet to be acknowledged. Un-ack set.
Push
  • Calculate the score as a function of message timeout (delayed queue) and priority
  • Add to sortedset for queue
  • Add message payload by ID into Redis hashed set with key as message ID.
Poll
  • Calculate max score as current time
  • Get messages with score between 0 and max
  • Add the message ID to unack set and remove from the sorted set for the queue.
  • If the previous step succeeds, retrieve the message payload from the Redis set based on ID
Ack
  • Remove from unack set by ID
  • Remove from the message payload set

Messages that are not acknowledged by the client are pushed back to the queue (at-least once semantics).

Availability Zone / Rack Awareness

Our queue recipe was built on top of Dynomite’s Java client, Dyno. Dyno provides connection pooling for persistent connections, and can be configured to be topology aware (token aware). Moreover, Dyno provides application specific local rack (in AWS a rack is a zone, e.g. us-east-1a, us-east-1b etc.) affinity based on request routing to Dynomite nodes. A client in us-east-1a will connect to a Dynomite/Redis node in the same AZ (unless the node is not available, in which case the  client will failover).  This property is exploited for sharding the queues by availability zone.

Sharding

Queues are sharded based on the availability zone. When pushing an element to the queue, the shard is determined based on round robin. This will ensure eventually all the shards are balanced. Each shard represents a sorted set on Redis with key being combination of queueName & AVAILABILITY _ZONE.

Dynomite consistency

The message broker uses a Dynomite cluster with consistency level set to DC_SAFE_QUORUM. Reads and writes are propagated synchronously to quorum number of nodes in the local data center and asynchronously to the rest. The DC_SAFE_QUORUM configuration writes to the number of nodes that make up a quorum. A quorum is calculated, and then rounded down to a whole number. This consistency level ensures all the writes are acknowledged by majority quorum.

Avoiding Global Locks


  • Each node (N1...Nn in the above diagram) has affinity to the availability zone and talks to the redis servers in that zone.
  • A Dynomite/Redis node serves only one request at a time. Dynomite can hold thousands of concurrent connections, however requests are processed by a single thread inside Redis.  This ensures when two concurrent calls are issued to poll an element from queue, they are served sequentially by Redis server avoiding any local or distributed locks on the message broker side.
  • In an event of failover, DC_SAFE_QUORUM write ensures no two client connections are given the same message out of a queue, as write to UNACK collection will only succeed for a single node for a given element.  This ensures if the same element is picked up by two broker nodes (in an event of a failover connection to Dynomite) only one will be able to add the message to the UNACK collection and another will receive failure. The failed node then moves onto peek another message from the queue to process.

Queue Maintenance Considerations

Queue Rebalancing

Useful when queues are not balanced or new availability zone is added or an existing one is removed permanently.

Handling Un-Ack’ed messages

A background process monitors for the messages in the UNACK collections that are not acknowledged by a client in a given time (configurable per queue). These messages are moved back into the queue.

Further extensions

Multiple consumers

A modified version can be implemented, where the consumer can “subscribe” for a message type (message type being metadata associated with a message) and a message is delivered to all the interested consumers.

Ephemeral Queues

Ephemeral queues have messages with a specified TTL and are only available to consumer until the TTL expires. Once expired, the messages are removed from queue and no longer visible to consumer. The recipe can be modified to add TTL to messages thereby creating an ephemeral queue. When adding elements to the Redis collections, they can be TTLed, and will be removed from collection by Redis upon expiry.

Other messaging solutions considered

  1. Kafka
Kafka provides robust messaging solution with at-least once delivery semantics.  Kafka lends itself well for message streaming use cases.  Kafka makes it harder to implement the semantics around priority queues and time based queue (both are required for our primary use case).  Case can be made to create large number of partitions in a queue to handle client usage - but then again adding a message broker in the middle will complicate things further.
  1. SQS
Amazon SQS is a viable alternative and depending upon the use case might be a good fit.  However, SQS does not support priority or time based queues beyond 15 minute delay.
  1. Disque
Disque is a project that aims to provide distributed queues with Redis like semantics. At the time we started working on this project, Disque was in beta (RC is out).
  1. Zookeeper (or comparable) distributed locks / coordinator based solutions
A distributed queue can be built with Cassandra or similar backend with zookeeper as the global locking solution. However, zookeeper quickly becomes the bottleneck as the no. of clients grow adding to the latencies.  Cassandra itself is known to have queues as anti-pattern use case.

Performance Tests

Below are some of the performance numbers for the queues implemented using the above recipe. The numbers here measures the server side latencies and does not include the network time between client and server. The Dynomite cluster as noted above runs with DC_SAFE_QUORUM consistency level guarantee.

Cluster Setup

Dynomite
3 x r3.2xlarge, us-east-1, us-west-2, eu-west-1
Message Broker
3 x m3.xlarge, us-east-1
Publisher / Consumer
m3.large, us-east-1


Dynomite cluster is deployed across 3 regions providing higher availability in case of region outages. Broker talks to the Dynomite cluster in the same region (unless the entire region fails over) as the test focuses on the measuring latencies within the region. For very high availability use cases, message broker could  be deployed in multiple region along with Dynomite cluster.

Results


Events Per Second
Poll Latency (in millisecond)
Push Latency (in millisecond)
Avg
95th
99th
Avg
95th
99th
90
5.6
7.8
88
1.3
1.3
2.2
180
2.9
2.4
12.3
1.3
1.3
2.1
450
4.5
2.6
104
1.2
1.5
2.1
1000
10
15
230
1.8
3.3
6.3


Conclusion

We built the queue recipe based on the need for micro-services orchestration. Building the recipe on top of Dynomite, provides flexibility for us to port the solution to other storage engine depending upon the workload needs.  We think the recipe is hackable enough to support further use cases. We are releasing the recipe to open source: https://github.com/Netflix/dyno-queues.

If you like the challenges of building distributed systems and are interested in  building the Netflix studio eco-system and the content pipeline at scale, check out our job openings.


Engineering Trade-Offs and The Netflix API Re-Architecture

$
0
0
Netflix’s engineering culture is predicated on Freedom & Responsibility, the idea that everyone (and every team) at Netflix is entrusted with a core responsibility. Within that framework they are free to operate with freedom to satisfy their mission. Accordingly, teams are generally responsible for all aspects of their systems, ranging from design, architecture, development, deployments, and operations. At the same time, it is inefficient to have all teams build everything that they need from scratch, given that there are often commonalities in the infrastructure needs of teams. We (like everyone else) value code reuse and consolidation where appropriate.

Given these two ideas (Freedom & Responsibility and leveragability of code), how can an individual and/or team figure out what they should optimize for themselves and what they should inherit from a centralized team? These kinds of trade-offs are pervasive in making engineering decisions, and Netflix is no exception.

The Netflix API is the service that handles the (sign-up, discovery and playback) traffic from all devices from all users. Over the last few years, the service has grown in a number of different dimensions: it’s grown in complexity, its request volume has increased, and Netflix’s subscriber base has grown as we expanded to most countries in the world. As the demands on the Netflix API continue to rise, the architecture that supports this massive responsibility is starting to approach its limits. As a result, we are working on a new architecture to position us well for the future (see a recent presentation at QCon for more details). This post explores the challenge of how, in the course of our re-architecture, we work to reconcile seemingly conflicting engineering principles: velocity and full ownership vs. maximum code reuse and consolidation.

Microservices Orchestration in the Netflix API
The Netflix API is the “front door” to the Netflix ecosystem of microservices. As requests come from devices, the API provides the logic of composing calls to all services that are required to construct a response. It gathers whatever information it needs from the backend services, in whatever order needed, formats and filters the data as necessary, and returns the response.

So, at its core, the Netflix API is an orchestration service that exposes coarse grained APIs by composing fined grained functionality provided by the microservices.
To make this happen, the API has at least four primary requirements: provide a flexible request protocol; map requests to one or more fine-grained APIs to backend microservices; provide a common resiliency abstraction to protect backend microservices; and create a context boundary (“buffer”) between device and backend teams.  

Today, the API service exposes three categories of coarse grained APIs: non-member (sign-up, billing, free trial, etc.), discovery (recommended shows and movies, search, etc.) and playback (decisions regarding the streaming experience, licensing to ensure users can view specific content, viewing history, heartbeats for user bookmarking, etc.).

Consider an example from the playback category of APIs. Suppose a user clicks the “play” button for Stranger Things Episode 1 on their mobile phone. In order for playback to begin, the mobile phone sends a “play” request to the API. The API in turn calls several microservices under the hood. Some of these calls can be made in parallel, because they don’t depend on each other. Others have to be sequenced in a specific order. The API contains all the logic to sequence and parallelize the calls as necessary. The device, in turn, doesn’t need to know anything about the orchestration that goes on under the hood when the customer clicks “play”.


 Figure 1: Devices send requests to API, which orchestrates the ecosystem of microservices.


Playback requests, with some exceptions, map only to playback backend services. There are many more discovery and non-member dependent services than playback services, but the separation is relatively clean, with only a few services needed both for playback and non-playback requests.

This is not a new insight for us, and our organizational structure reflects this. Today, two teams, both the API and the Playback teams, contribute to the orchestration layer, with the Playback team focusing on Playback APIs. However, only the API team is responsible for the full operations of the API, including releases, 24/7 support, rollbacks, etc. While this is great for code reuse, it goes against our principle of teams owning and operating in production what they build.

With this in mind, the goals to address in the new architecture are:
  • We want each team to own and operate in production what they build. This will allow more targeted alerting, and faster MTTR.
  • Similarly, we want each team to own their own release schedule and wherever possible not have releases held up by unrelated changes.

Two competing approaches
As we look into the future, we are considering two options. In option 1 (see figure 2), the orchestration layer in the API will, for all playback requests, be a pass-through and simply send the requests on to the playback-specific orchestration layer. The playback orchestration layer would then play the role of orchestrating between all playback services. The one exception to a full pass-through model is the small set of shared services, where the orchestration layer in the API would enrich the request with whatever information the playback orchestration layer needs in order to service the request.


Figure 2: OPTION 1: Pass-through orchestration layer with playback-specific orchestration layer


Alternatively, we could simply split into two separate APIs (see figure 3).


Figure 3: OPTION 2: Separate playback and discovery/non-member APIs


Both of the approaches actually solve the challenges we set out to solve: for each option, each team will own the release cycle as well as the production operations of their own orchestration layer - a step forward in our minds. This means that the choice between the two options comes down to other factors. Below we discuss some of our considerations.

Developer Experience
The developers who use our API (i.e., Netflix’s device teams) are top priority when designing, building and supporting the new API. They will program against our API daily, and it is important for our business that their developer experience and productivity is excellent. Two of the top concerns in this area are discovery and documentation: our partner teams will need to know how to interact with the API, what parameters to pass in and what they can expect back. Another goal is flexibility: due to the complex needs we have for 1000+ device types, our API must be extremely flexible. For instance, a device may want to request a different number of videos, and different properties about them, than another device would. All of this work will be important to both playback and non-playback APIs, so how is this related to the one vs. two APIs discussion? One API facilitates more uniformity in those areas: how requests are made and composed, how the API is documented, where and how teams find out about changes or additions to the API, API versioning, tools to optimize the developer experience, etc. If we go the route of two APIs, this is all still possible, but we will have to work harder across the two teams to achieve this.

Organizational implications and shared components
The two teams are very close and collaborate effectively on the API today. However, we are keenly aware that a decision to create two APIs, owned by two separate teams, can have profound implications. Our goals would, and should, be minimal divergence between the two APIs. Developer experience, as noted above, is one of the reasons. More broadly, we want to maximize the reuse of any components that are relevant to both APIs. This also includes any orchestration mechanisms, and any tools, mechanisms, and libraries related to scalability, reliability, and resiliency. The risk is that the two APIs could drift apart over time. What would that mean? For one, it could have organizational consequences (e.g., need for more staff). We could end up in a situation where we have valued ownership of components to a degree that we have abandoned component reuse. This is not a desirable outcome for us, and we would have to be very thoughtful about any divergence between the two APIs.

Even in a world where we have a significant amount of code use, we recognize that the operational overhead will be higher. As noted above, the API is critical to the Netflix service functioning properly for customers. Up until now, only one of the teams has been tasked with making the system highly scalable and highly resilient, and carrying the operational burden. The team has spent years building up expertise and experience in system scale and resiliency. By creating two APIs, we would be distributing these tasks and responsibilities to both teams.

Simplicity
If one puts the organizational considerations aside, two separate APIs is simply the cleaner architecture. In option 1, if the API acts largely as a pass-through, is it worth incurring the extra hop? Every playback request that would come into the API would simply be passed along to the playback orchestration layer without providing much functional value (besides the small set of functionality needed from the shared services). If the components that we build for discovery, insights, resiliency, orchestration, etc. can be reused in both APIs, the simplicity of having a clean separation between the two APIs is appealing. Moreover, as mentioned briefly above, option 1 also requires two teams to be involved for Playback API pushes that change the interaction model, while option 2 truly separates out the deployments.

Where does all of this leave us? We realize that this decision will have long-lasting consequences. But in taking all of the above into consideration, we have also come to understand that there is no perfect solution. There is no right or wrong, only trade-offs. Our path forward is to make informed assumptions and then experiment and build based on them. In particular, we are experimenting with how much we can generalize the building blocks we have already built and are planning to build, so that they could be used in both APIs. If this proves fruitful, we will then build two APIs. Despite the challenges, we are optimistic about this path and excited about the future of our services. If you are interested in helping us tackle this and other equally interesting challenges, come join us! We are hiring for several differentroles.

By Katharina Probst, Justin Becker

A Large-Scale Comparison of x264, x265, and libvpx - a Sneak Peek

$
0
0
With 83+ million members watching billions of hours of TV shows and movies, Netflix sends a huge amount of video bits through the Internet. As we grow globally, more of these video bits will be streamed through bandwidth-constrained cellular networks. Our team works on improving our video compression efficiency to ensure that we are good stewards of the Internet while at the same time delivering the best video quality to our members. Part of the effort is to evaluate the state-of-the-art video codecs, and adopt them if they provide substantial compression gains.

H.264/AVC is a very widely-used video compression standard on the Internet, with ubiquitous decoder support on web browsers, TVs, mobile devices, and other consumer devices. x264 is the most established open-source software encoder for H.264/AVC. HEVC is the successor to H.264/AVC and results reported from standardization showed about 50% bitrate savings for the same quality compared to H.264/AVC. x265 is an open-source HEVC encoder, originally ported from the x264 codebase. Concurrent to HEVC, Google developed VP9 as a royalty-free video compression format and released libvpx as an open-source software library for encoding VP9. YouTube reported that by encoding with VP9, they can deliver video at half the bandwidth compared to legacy codecs.

We ran a large-scale comparison of x264, x265 and libvpx to see for ourselves whether this 50% bandwidth improvement is applicable to our use case. Most codec comparisons in the past focused on evaluating what can be achieved by the bitstream syntax (using the reference software), applied settings that do not fully reflect our encoding scenario, or only covered a limited set of videos. Our goal was to assess what can be achieved by encoding with practical codecs that can be deployed to a production pipeline, on the Netflix catalog of movies and TV shows, with encoding parameters that are useful to a streaming service. We sampled 5000 12-second clips from our catalog, covering a wide range of genres and signal characteristics. With 3 codecs, 2 configurations, 3 resolutions (480p, 720p and 1080p) and 8 quality levels per configuration-resolution pair, we generated more than 200 million encoded frames. We applied six quality metrics - PSNR, PSNRMSE, SSIM, MS-SSIM, VIF and VMAF - resulting in more than half a million bitrate-quality curves. This encoding work required significant compute capacity. However, our cloud-based encoding infrastructure, which leverages unused Netflix-reserved AWS web servers dynamically, enabled us to complete the experiments in just a few weeks.

What did we learn?
Here’s a snapshot: x265 and libvpx demonstrate superior compression performance compared to x264, with bitrate savings reaching up to 50% especially at the higher resolutions. x265 outperforms libvpx for almost all resolutions and quality metrics, but the performance gap narrows (or even reverses) at 1080p.

Want to know more?
We will present our methodology and results this coming Wednesday, August 31, 8:00 am PDT at the SPIE Applications of Digital Image Processing conference, Session 7: Royalty-free Video. We will stream the whole session live on Periscope and YouTube: follow Anne for notifications or come back to this page for links to the live streams. This session will feature other interesting technical work from leaders in the field of Royalty-Free Video. We will also follow-up with a more detailed tech blog post and extend the results to include 4K encodes.

Update: Links to Live Streams
Periscope (We'll monitor comments and questions on the broadcast)
YouTube Live

By Jan De Cock, Aditya Mavlankar, Anush Moorthy and Anne Aaron

Netflix Data Benchmark: Benchmarking Cloud Data Stores

$
0
0
The Netflix member experience is offered to 83+ million global members, and delivered using thousands of microservices. These services are owned by multiple teams, each having their own build and release lifecycles, generating a variety of data that is stored in different types of data store systems. The Cloud Database Engineering (CDE) team manages those data store systems, so we run benchmarks to validate updates to these systems, perform capacity planning, and test our cloud instances with multiple workloads and under different failure scenarios. We were also interested in a tool that could evaluate and compare new data store systems as they appear in the market or in the open source domain, determine their performance characteristics and limitations, and gauge whether they could be used in production for relevant use cases. For these purposes, we wrote Netflix Data Benchmark (NDBench), a pluggable cloud-enabled benchmarking tool that can be used across any data store system. NDBench provides plugin support for the major data store systems that we use -- Cassandra (Thrift and CQL), Dynomite (Redis), and Elasticsearch. It can also be extended to other client APIs.

Introduction

As Netflix runs thousands of microservices, we are not always aware of the traffic that bundled microservices may generate on our backend systems. Understanding the performance implications of new microservices on our backend systems was also a difficult task. We needed a framework that could assist us in determining the behavior of our data store systems under various workloads, maintenance operations and instance types. We wanted to be mindful of provisioning our clusters, scaling them either horizontally (by adding nodes) or vertically (by upgrading the instance types), and operating under different workloads and conditions, such as node failures, network partitions, etc.


As new data store systems appear in the market, they tend to report performance numbers for the “sweet spot”, and are usually based on optimized hardware and benchmark configurations. Being a cloud-native database team, we want to make sure that our systems can provide high availability under multiple failure scenarios, and that we are utilizing our instance resources optimally. There are many other factors that affect the performance of a database deployed in the cloud, such as instance types, workload patterns, and types of deployments (island vs global). NDBench aids in simulating the performance benchmark by mimicking several production use cases.


There were also some additional requirements; for example, as we upgrade our data store systems (such as Cassandra upgrades) we wanted to test the systems prior to deploying them in production. For systems that we develop in-house, such as Dynomite, we wanted to automate the functional test pipelines, understand the performance of Dynomite under various conditions, and under different storage engines. Hence, we wanted a workload generator that could be integrated into our pipelines prior to promoting an AWS AMI to a production-ready AMI.


We looked into various benchmark tools as well as REST-based performance tools. While some tools covered a subset of our requirements, we were interested in a tool that could achieve the following:
  • Dynamically change the benchmark configurations while the test is running, hence perform tests along with our production microservices.
  • Be able to integrate with platform cloud services such as dynamic configurations, discovery, metrics, etc.
  • Run for an infinite duration in order to introduce failure scenarios and test long running maintenances such as database repairs.
  • Provide pluggable patterns and loads.
  • Support different client APIs.
  • Deploy, manage and monitor multiple instances from a single entry point.
For these reasons, we created Netflix Data Benchmark (NDBench). We incorporated NDBench into the Netflix Open Source ecosystem by integrating it with components such as Archaius for configuration, Spectator for metrics, and Eureka for discovery service. However, we designed NDBench so that these libraries are injected, allowing the tool to be ported to other cloud environments, run locally, and at the same time satisfy our Netflix OSS ecosystem users.

NDBench Architecture

The following diagram shows the architecture of NDBench. The framework consists of three components:
  • Core: The workload generator
  • API: Allowing multiple plugins to be developed against NDBench
  • Web: The UI and the servlet context listener
We currently provide the following client plugins -- Datastax Java Driver (CQL), C* Astyanax (Thrift), Elasticsearch API, and Dyno (Jedis support). Additional plugins can be added, or a user can use dynamic scripts in Groovy to add new workloads. Each driver is just an implementation of the Driver plugin interface.

NDBench-core is the core component of NDBench, where one can further tune workload settings.


Fig. 1: NDBench Architecture


NDBench can be used from either the command line (using REST calls), or from a web-based user interface (UI).

NDBench Runner UI

ndbench-ui-2.jpg
Fig.2: NDBench Runner UI


A screenshot of the NDBench Runner (Web UI) is shown in Figure 2. Through this UI, a user can select a cluster, connect a driver, modify settings, set a load testing pattern (random or sliding window), and finally run the load tests. Selecting an instance while a load test is running also enables the user to view live-updating statistics, such as read/write latencies, requests per second, cache hits vs. misses, and more.

Load Properties

NDBench provides a variety of input parameters that are loaded dynamically and can dynamically change during the workload test. The following parameters can be configured on a per node basis:
  • numKeys: the sample space for the randomly generated keys
  • numValues: the sample space for the generated values
  • dataSize: the size of each value
  • numWriters/numReaders: the number of threads per NDBench node for writes/reads
  • writeEnabled/readEnabled: boolean to enable or disable writes or reads
  • writeRateLimit/readRateLimit: the number of writes per second and reads per seconds
  • userVariableDataSize: boolean to enable or disable the ability of the payload to be randomly generated.

Types of Workload

NDBench offers pluggable load tests. Currently it offers two modes -- random traffic and sliding window traffic. The sliding window test is a more sophisticated test that can concurrently exercise data that is repetitive inside the window, thereby providing a combination of temporally local data and spatially local data. This test is important as we want to exercise both the caching layer provided by the data store system, as well as the disk’s IOPS (Input/Output Operations Per Second).

Load Generation

Load can be generated individually for each node on the application side, or all nodes can generate reads and writes simultaneously. Moreover, NDBench provides the ability to use the “backfill” feature in order to start the workload with hot data. This helps in reducing the ramp up time of the benchmark.

NDBench at Netflix

NDBench has been widely used inside Netflix. In the following sections, we talk about some use cases in which NDBench has proven to be a useful tool.

Benchmarking Tool

A couple of months ago, we finished the Cassandra migration from version 2.0 to 2.1. Prior to starting the process, it was imperative for us to understand the performance gains that we would achieve, as well as the performance hit we would incur during the rolling upgrade of our Cassandra instances. Figures 3 and 4 below illustrate  the p99 and p95 read latency differences using NDBench. In Fig. 3, we highlight the differences between Cassandra 2.0 (blue line) vs 2.1 (brown line).


Fig.3: Capturing OPS and latency percentiles of Cassandra


Last year, we also migrated all our Cassandra instances from the older Red Hat 5.10 OS to Ubuntu 14.04 (Trusty Tahr). We used NDBench to measure performance under the newer operating system. In Figure 4, we showcase the three phases of the migration process by using NDBench’s long-running benchmark capability. We used rolling terminations of the Cassandra instances to update the AMIs with the new OS, and NDBench to verify that there would be no client-side impact during the migration. NDBench also allowed us to validate that the performance of the new OS was better after the migration.


Fig.4: Performance improvement from our upgrade from Red Hat 5.10 to Ubuntu 14.04

AMI Certification Process

NDBench is also part of our AMI certification process, which consists of integration tests and deployment validation. We designed pipelines in Spinnaker and integrated NDBench into them. The following figure shows the bakery-to-release lifecycle. We initially bake an AMI with Cassandra, create a Cassandra cluster, create an NDBench cluster, configure it, and run a performance test. We finally review the results, and make the decision on whether to promote an “Experimental” AMI to a “Candidate”. We use similar pipelines for Dynomite, testing out the replication functionalities with different client-side APIs. Passing the NDBench performance tests means that the AMI is ready to be used in the production environment. Similar pipelines are used across the board for other data store systems at Netflix.
Fig.5 NDBench integrated with Spinnaker pipelines


In the past, we’ve published benchmarks of Dynomite with Redis as a storage engine leveraging NDBench. In Fig. 6 we show some of the higher percentile latencies we derived from Dynomite leveraging NDBench.
Fig.6: P99 latencies for Dynomite with consistency set to DC_QUORUM with NDBench


NDBench allows us to run infinite horizon tests to identify potential memory leaks from long running processes that we develop or use in-house. At the same time, in our integration tests we introduce failure conditions, change the underlying variables of our systems, introduce CPU intensive operations (like repair/reconciliation), and determine the optimal performance based on the application requirements. Finally, our sidecars such as Priam, Dynomite-manager and Raigad perform various activities, such as multi-threaded backups to object storage systems. We want to make sure, through integration tests, that the performance of our data store systems is not affected.

Conclusion

For the last few years, NDBench has been a widely-used tool for functional, integration, and performance testing, as well as AMI validation. The ability to change the workload patterns during a test, support for different client APIs, and integration with our cloud deployments has greatly helped us in validating our data store systems. There are a number of improvements we would like to make to NDBench, both for increased usability and supporting additional features. Some of the features that we would like to work on include:
  • Performance profile management
  • Automated canary analysis
  • Dynamic load generation based on destination schemas
NDBench has proven to be extremely useful for us on the Cloud Database Engineering team at Netflix, and we are happy to have the opportunity to share that value. Therefore, we are releasing NDBench as an open source project, and are looking forward to receiving feedback, ideas, and contributions from the open source community. You can find NDBench on Github at: https://github.com/Netflix/ndbench


If you enjoy the challenges of building distributed systems and are interested in working with the Cloud Database Engineering team in solving next-generation data store problems, check out ourjob openings.


Authors: Vinay Chella, Ioannis Papapanagiotou, and Kunal Kundaje

Netflix OSS Meetup Recap - September 2016

$
0
0
Last week, we welcomed roughly 200 attendees to Netflix HQ in Los Gatos for Season 4, Episode 3 of our Netflix OSS Meetup. The meetup group was created in 2013 to discuss our various OSS projects amongst the broader community of OSS enthusiasts. This episode centered around security-focused OSS releases, and speakers included both Netflix creators of security OSS as well as community users and contributors.

We started the night with an hour of networking, Mexican food, and drinks. As we kicked off the presentations, we discussed the history of security OSS at Netflix - we first released Security Monkey in 2014, and we're closing in on our tenth security release, likely by the end of 2016. The slide below provides a comprehensive timeline of the security software we've released as Netflix OSS.


Wes Miaw of Netflix began the presentations with a discussion of MSL (Message Security Layer), a modern security protocol that addresses a number of difficult security problems. Next was Patrick Kelley, also of Netflix, who gave the crowd an overview of Repoman, an upcoming OSS release that works to right-size permissions within Amazon Web Services environments.

Next up were our external speakers. Vivian Ho and Ryan Lane of Lyft discussed their use of BLESS, an SSH Certificate Authority implemented as an AWS Lambda function. They're using it in conjunction with their OSS kmsauth to provide engineers SSH access to AWS instances. Closing the presentations was Chris Dorros of OpenDNS/Cisco. Chris talked about his contribution to Lemur, the SSL/TLS certificate management system we open sourced last year. Chris has added functionality to support the DigiCert Certificate Authority. After the presentations, the crowd moved back to the cafeteria, where we'd set up demo stations for a variety of our security OSS releases.

Patrick Kelley talking about Repoman


Thanks to everyone who attended - we're planning the next meetup for early December 2016. Join our group for notifications. If you weren't able to attend, we have both the slides and video available.

Upcoming Talks from the Netflix Security Team

Below is a schedule of upcoming presentations from members of the Netflix security team (through 2016). If you'd like to hear more talks from Netflix security, some of our past presentations are available on our YouTube channel


Speakers
Conference
Talk
Automacon (Portland, OR) Sept 27-29, 2016
Scott Behrens and Andy Hoernecke
AppSecUSA 2016 (DC) - Oct 11-14, 2016
Scott Behrens and Andy Hoernecke
O'Reilly Security NYC (NYC) - Oct 30-Nov 2, 2016
Ping Identify SF (San Francisco) - Nov 2, 2016
Co-Keynote
QConSF (San Francisco) - Nov 7-11, 2016
The Psychology of Security Automation
Manish Mehta
AWS RE:invent (Las Vegas) - Nov 28-Dec 2, 2016
Solving the First Secret Problem: Securely Establishing Identity using the AWS Metadata Service
AWS RE:invent (Las Vegas) - Nov 28-Dec 2, 2016

If you're interested in solving interesting security problems while developing OSS that the rest of the world can use, we'd love to hear from you! Please see our jobs site for openings.

By Jason Chan

IMF: AN OPEN STANDARD WITH OPEN TOOLS

$
0
0

Why IMF?


As Netflix expanded into a global entertainment platform, our supply chain needed an efficient way to vault our masters in the cloud that didn’t require a different version for every territory in which we have our service.  A few years ago we discovered the Interoperable Master Format (IMF), a standard created by the Society of Motion Picture and Television Engineers (SMPTE). The IMF framework is based on the Digital Cinema standard of component based elements in a standard container with assets being mapped together via metadata instructions.  By using this standard, Netflix is able to hold a single set of core assets and the unique elements needed to make those assets relevant in a local territory.  So for a title like Narcos, where the video is largely the same in all territories, we can hold the Primary AV and the specific frames that are different for, say, the Japanese title sequence version.  This reduces duplication of assets that are 95% the same and allows us to hold that 95% once and piece it to the 5% differences needed for a specific use case.   The format also serves to minimize the risk of multiple versions being introduced into our vault, and allows us to keep better track of our assets, as they stay within one contained package, even when new elements are introduced.  This allows us to avoid “versionitis” as outlined in this previous blog.  We can leverage one set of master assets and utilize supplemental or additional master assets in IMF to make our localized language versions, as well as any transcoded versions, without needing to store anything more than master materials.  Primary AV, supplemental AV, subtitles, non-English audio and other assets needed for global distribution can all live in an “uber” master that can be continually added to as needed rather than recreated.  When a “virtual-version” is needed, the instructions simply need to be created, not the whole master.  IMF provides maximum flexibility without having to actually create every permutation of a master.  


OSS for IMF:


Netflix has a history of identifying shared problems within industries and seeking solutions via open source tools.  Because many of our content partners have the same issues Netflix has with regard to global versions of their content, we saw IMF as a shared opportunity in the digital supply chain space.  In order to support IMF interoperability and share the benefits of the format with the rest of the content community, we have invested in several open source IMF tools.  One example of these tools is the IMF Transform Tool which gives users the ability to transcode from IMF to DPP (Digital Production Partnership).  Realizing Netflix is only one recipient of assets from content owners, we wanted to create a solution that would allow them to enjoy the benefits of IMF and still create deliverables to existing outlets.  Similarly, Netflix understands the EST business is still important to content owners, so we’re adding another open source transform tool that will go from IMF to an iTunes-compatible like package (when using Apple ProRes encoder). This will allow users to take a SMPTE compliant IMF and convert it to a package which can be used for TVOD delivery without incurring significant costs via proprietary tools.  A final shared problem is editing those sets of instructions we mentioned earlier.  There are many great tools in the marketplace that create IMF packages, and while they are fully featured and offer powerful solutions for creating IMFs, they can be overkill for making quick changes to a CPL (Content Play List).  Things like adding metadata markers,EIDRnumbers or other changes to the instructions for that IMF can all be done in our newly released OSS IMF CPL Editor.  This leaves the fully functioned commercial software/hardware tools open in facilities for IMF creation and not tied up making small changes to metadata.


IMF Transforms

The IMF Transform uses other open source technologies from Java, ffmpeg, bmxlib and x.264 in the framework.  These tools and their source code can be found on GitHub at


IMF CPL Editor


The IMF CPL Editor is cross platform and can be compiled on Mac, Windows and/or Linux operating systems.  The tool will open a composition playlist (CPL) in a timeline and list all assets.  The essence files will be supported in .mxf wrapped .wav, .ttml or .imsc files. The user can add, edit and delete audio, subtitle and metadata assets from the timeline. The edits can be saved back to the existing CPL or saved as a new CPL modifying the Packing List (PKL) and Asset Map as well.  The source code and compiled tool will be open source and available at (https://github.com/IMFTool)


What’s Next:


We hope others will branch these open source efforts and make even more functions available to the growing community of IMF users.  It would be great to see a transform function to other AS-11 formats, XDCAM 50 or other widely used broadcast “play-out” formats.  In addition to the base package functionality that currently exists, Netflix will be adding supplemental package support to the IMF CPL Editor in October. We look forward to seeing what developers create. These solutions coupled with thePhotontool Netflix has already released create strong foundations to make having an efficient and comprehensive library in IMF an achievable goal for content owners seeking to exploit their assets in the global entertainment market.

By: Chris Fetner and Brian Kenworthy

Zuul 2 : The Netflix Journey to Asynchronous, Non-Blocking Systems

$
0
0
We recently made a major architectural change to Zuul, our cloud gateway. Did anyone even notice!?  Probably not... Zuul 2 does the same thing that its predecessor did -- acting as the front door to Netflix’s server infrastructure, handling traffic from all Netflix users around the world.  It also routes requests, supports developers’ testing and debugging, provides deep insight into our overall service health, protects Netflix from attacks, and channels traffic to other cloud regions when an AWS region is in trouble. The major architectural difference between Zuul 2 and the original is that Zuul 2 is running on an asynchronous and non-blocking framework, using Netty.  After running in production for the last several months, the primary advantage (one that we expected when embarking on this work) is that it provides the capability for devices and web browsers to have persistent connections back to Netflix at Netflix scale.  With more than 83 million members, each with multiple connected devices, this is a massive scale challenge.  By having a persistent connection to our cloud infrastructure, we can enable lots of interesting product features and innovations, reduce overall device requests, improve device performance, and understand and debug the customer experience better.  We also hoped the Zuul 2 would offer resiliency benefits and performance improvements, in terms of latencies, throughput, and costs.  But as you will learn in this post, our aspirations have differed from the results.

Differences Between Blocking vs. Non-Blocking Systems

To understand why we built Zuul 2, you must first understand the architectural differences between asynchronous and non-blocking (“async”) systems vs. multithreaded, blocking (“blocking”) systems, both in theory and in practice.  

Zuul 1 was built on the Servlet framework. Such systems are blocking and multithreaded, which means they process requests by using one thread per connection. I/O operations are done by choosing a worker thread from a thread pool to execute the I/O, and the request thread is blocked until the worker thread completes. The worker thread notifies the request thread when its work is complete. This works well with modern multi-core AWS instances handling 100’s of concurrent connections each. But when things go wrong, like backend latency increases or device retries due to errors, the count of active connections and threads increases. When this happens, nodes get into trouble and can go into a death spiral where backed up threads spike server loads and overwhelm the cluster.  To offset these risks, we built in throttling mechanisms and libraries (e.g., Hystrix) to help keep our blocking systems stable during these events.


Multithreaded System Architecture

Async systems operate differently, with generally one thread per CPU core handling all requests and responses. The lifecycle of the request and response is handled through events and callbacks. Because there is not a thread for each request, the cost of connections is cheap. This is the cost of a file descriptor, and the addition of a listener. Whereas the cost of a connection in the blocking model is a thread and with heavy memory and system overhead. There are some efficiency gains because data stays on the same CPU, making better use of CPU level caches and requiring fewer context switches. The fallout of backend latency and “retry storms” (customers and devices retrying requests when problems occur) is also less stressful on the system because connections and increased events in the queue are far less expensive than piling up threads.


Asynchronous and Non-blocking System Architecture

The advantages of async systems sound glorious, but the above benefits come at a cost to operations. Blocking systems are easy to grok and debug. A thread is always doing a single operation so the thread’s stack is an accurate snapshot of the progress of a request or spawned task; and a thread dump can be read to follow a request spanning multiple threads by following locks. An exception thrown just pops up the stack. A “catch-all” exception handler can cleanup everything that isn’t explicitly caught.   

Async, by contrast, is callback based and driven by an event loop. The event loop’s stack trace is meaningless when trying to follow a request. It is difficult to follow a request as events and callbacks are processed, and the tools to help with debugging this are sorely lacking in this area. Edge cases, unhandled exceptions, and incorrectly handled state changes create dangling resources resulting in ByteBuf leaks, file descriptor leaks, lost responses, etc. These types of issues have proven to be quite difficult to debug because it is difficult to know which event wasn’t handled properly or cleaned up appropriately.


Building Non-Blocking Zuul

Building Zuul 2 within Netflix’s infrastructure was more challenging than expected. Many services within the Netflix ecosystem were built with an assumption of blocking.  Netflix’s core networking libraries are also built with blocking architectural assumptions; many libraries rely on thread local variables to build up and store context about a request. Thread local variables don’t work in an async non-blocking world where multiple requests are processed on the same thread.  Consequently, much of the complexity of building Zuul 2 was in teasing out dark corners where thread local variables were being used. Other challenges involved converting blocking networking logic into non-blocking networking code, and finding blocking code deep inside libraries, fixing resource leaks, and converting core infrastructure to run asynchronously.  There is no one-size-fits-all strategy for converting blocking network logic to async; they must be individually analyzed and refactored. The same applies to core Netflix libraries, where some code was modified and some had to be forked and refactored to work with async.  The open source project Reactive-Audit was helpful by instrumenting our servers to discover cases where code blocks and libraries were blocking.

We took an interesting approach to building Zuul 2. Because blocking systems can run code asynchronously, we started by first changing our Zuul Filters and filter chaining code to run asynchronously.  Zuul Filters contain the specific logic that we create to do our gateway functions (routing, logging, reverse proxying, ddos prevention, etc). We refactored core Zuul, the base Zuul Filter classes, and our Zuul Filters using RxJava to allow them to run asynchronously. We now have two types of filters that are used together: async used for I/O operations, and a sync filter that run logical operations that don’t require I/O.  Async Zuul Filters allowed us to execute the exact same filter logic in both a blocking system and a non-blocking system.  This gave us the ability to work with one filter set so that we could develop gateway features for our partners while also developing the Netty-based architecture in a single codebase. With async Zuul Filters in place, building Zuul 2 was “just” a matter of making the rest of our Zuul infrastructure run asynchronously and non-blocking. The same Zuul Filters could just drop into both architectures.


Results of Zuul 2 in Production

Hypotheses varied greatly on benefits of async architecture with our gateway. Some thought we would see an order of magnitude increase in efficiency due to the reduction of context switching and more efficient use of CPU caches and others expected that we’d see no efficiency gain at all.  Opinions also varied on the complexity of the change and development effort. 

So what did we gain by doing this architectural change? And was it worth it? This topic is hotly debated. The Cloud Gateway team pioneered the effort to create and test async-based services at Netflix. There was a lot of interest in understanding how microservices using async would operate at Netflix, and Zuul looked like an ideal service for seeing benefits. 


While we did not see a significant efficiency benefit in migrating to async and non-blocking, we did achieve the goals of connection scaling. Zuul does benefit by greatly decreasing the cost of network connections which will enable push and bi-directional communication to and from devices. These features will enable more real-time user experience innovations and will reduce overall cloud costs by replacing “chatty” device protocols today (which account for a significant portion of API traffic) with push notifications. There also is some resiliency advantage in handling retry storms and latency from origin systems better than the blocking model. We are continuing to improve on this area; however it should be noted that the resiliency advantages have not been straightforward or without effort and tuning. 


With the ability to drop Zuul’s core business logic into either blocking or async architectures, we have an interesting apples-to-apples comparison of blocking to async.  So how do two systems doing the exact same real work, although in very different ways, compare in terms of features, performance and resiliency?  After running Zuul 2 in production for the last several months, our evaluation is that the more CPU-bound a system is, the less of an efficiency gain we see.  


We have several different Zuul clusters that front origin services like API, playback, website, and logging. Each origin service demands that different operations be handled by the corresponding Zuul cluster.  The Zuul cluster that fronts our API service, for example, does the most on-box work of all our clusters, including metrics calculations, logging, and decrypting incoming payloads and compressing responses.  We see no efficiency gain by swapping an async Zuul 2 for a blocking one for this cluster.  From a capacity and CPU point of view they are essentially equivalent, which makes sense given how CPU-intensive the Zuul service fronting API is. They also tend to degrade at about the same throughput per node. 


The Zuul cluster that fronts our Logging services has a different performance profile. Zuul is generally receiving logging and analytics messages from devices and is write-heavy, so requests are large, but responses are small and not encrypted by Zuul.  As a result, Zuul is doing much less work for this cluster.  While still CPU-bound, we see about a 25% increase in throughput corresponding with a 25% reduction in CPU utilization by running Netty-based Zuul.  We thus observed that the less work a system actually does, the more efficiency we gain from async. 


Overall, the value we get from this architectural change is high, with connection scaling being the primary benefit, but it does come at a cost. We have a system that is much more complex to debug, code, and test, and we are working within an ecosystem at Netflix that operates on an assumption of blocking systems. It is unlikely that the ecosystem will change anytime soon, so as we add and integrate more features to our gateway it is likely that we will need to continue to tease out thread local variables and other assumptions of blocking in client libraries and other supporting code.  We will also need to rewrite blocking calls asynchronously.  This is an engineering challenge unique to working with a well established platform and body of code that makes assumptions of blocking. Building and integrating Zuul 2 in a greenfield would have avoided some of these complexities, but we operate in an environment where these libraries and services are essential to the functionality of our gateway and operation within Netflix’s ecosystem.


We are in the process of releasing Zuul 2 as open source. Once it is released, we’d love to hear from you about your experiences with it and hope you will share your contributions! We plan on adding new features such as http/2 and websocket support to Zuul 2 so that the community can also benefit from these innovations.


- The Cloud Gateway Team (Mikey Cohen, Mike Smith, Susheel Aroskar, Arthur Gonigberg, Gayathri Varadarajan, and Sudheer Vinukonda)


To Be Continued: Helping you find shows to continue watching on Netflix

$
0
0

Introduction

Our objective in improving the Netflix recommendation system is to create a personalized experience that makes it easier for our members to find great content to enjoy. The ultimate goal of our recommendation system is to know the exact perfect show for the member and just start playing it when they open Netflix. While we still have a long way to achieve that goal, there are areas where we can reduce the gap significantly.

When a member opens the Netflix website or app, she may be looking to discover a new movie or TV show that she never watched before, or, alternatively, she may want to continue watching a partially-watched movie or a TV show she has been binging on. If we can reasonably predict when a member is more likely to be in the continuation mode and which shows she is more likely to resume, it makes sense to place those shows in prominent places on the home page.
While most recommendation work focuses on discovery, in this post, we focus on the continuation mode and explain how we used machine learning to improve the member experience for both modes. In particular, we focus on a row called “Continue Watching” (CW) that appears on the main page of the Netflix member homepage on most platforms. This row serves as an easy way to find shows that the member has recently (partially) watched and may want to resume. As you can imagine, a significant proportion of member streaming hours are spent on content played from this row.


Continue Watching

Previously, the Netflix app in some platforms displayed a row with recently watched shows (here we use the term show broadly to include all forms of video content on Netflix including movies and TV series) sorted by recency of last time each show was played. How the row was placed on the page was determined by some rules that depended on the device type. For example, the website only displayed a single continuation show on the top-left corner of the page. While these are reasonable baselines, we set out to unify the member experience of CW row across platforms and improve it along two dimensions:

  • Improve the placement of the row on the page by placing it higher when a member is more likely to resume a show (continuation mode), and lower when a member is more likely to look for a new show to watch (discovery mode)
  • Improve the ordering of recently-watched shows in the row using their likelihood to be resumed in the current session


Intuitively, there are a number of activity patterns that might indicate a member’s likelihood to be in the continuation mode. For example, a member is perhaps likely to resume a show if she:

  • is in the middle of a binge; i.e., has been recently spending a significant amount of time watching a TV show, but hasn’t yet reached its end
  • has partially watched a movie recently
  • has often watched the show around the current time of the day or on the current device
On the other hand, a discovery session is more likely if a member:
  • has just finished watching a movie or all episodes of a TV show
  • hasn’t watched anything recently
  • is new to the service
These hypotheses, along with the high fraction of streaming hours spent by members in continuation mode, motivated us to build machine learning models that can identify and harness these patterns to produce a more effective CW row.

Building a Recommendation Model for Continue Watching

To build a recommendation model for the CW row, we first need to compute a collection of features that extract patterns of the behavior that could help the model predict when someone will resume a show. These may include features about the member, the shows in the CW row, the member’s past interactions with those shows, and some contextual information. We then use these features as inputs to build machine learning models. Through an iterative process of variable selection, model training, and cross validation, we can refine and select the most relevant set of features.

While brainstorming for features, we considered many ideas for building the CW models, including:

  1. Member-level features:
    • Data about member’s subscription, such as the length of subscription, country of signup, and language preferences
    • How active has the member been recently
    • Member’s past ratings and genre preferences
  2. Features encoding information about a show and interactions of the member with it:
    • How recently was the show added to the catalog, or watched by the member
    • How much of the movie/show the member watched
    • Metadata about the show, such as type, genre, and number of episodes; for example kids shows may be re-watched more
    • The rest of the catalog available to the member
    • Popularity and relevance of the show to the member
    • How often do the members resume this show
  3. Contextual features:
    • Current time of the day and day of the week
    • Location, at various resolutions
    • Devices used by the member

Two applications, two models


As mentioned above, we have two tasks related to organizing a member's continue watching shows: ranking the shows within the CW row and placing the CW row appropriately on the member’s homepage.

Show ranking


To rank the shows within the row, we trained a model that optimizes a ranking loss function. To train it, we used sessions where the member resumed a previously-watched show - i.e., continuation sessions - from a random set of members. Within each session, the model learns to differentiate amongst candidate shows for continuation and ranks them in the order of predicted likelihood of play. When building the model, we placed special importance on having the model place the show of play at first position.

We performed an offline evaluation to understand how well the model ranks the shows in the CW row. Our baseline for comparison was the previous system, where the shows were simply sorted by recency of last time each show was played. This recency rank is a strong baseline (much better than random) and is also used as a feature in our new model. Comparing the model vs. recency ranking, we observed significant lift in various offline metrics. The figure below displays Precision@1 of the two schemes over time. One can see that the lift in performance is much greater than the daily variation.


This model performed significantly better than recency-based ranking in an A/B test and better matched our expectations for member behavior. As an example, we learned that the members whose rows were ranked using the new model had fewer plays originating from the search page. This meant that many members had been resorting to searching for a recently-watched show because they could not easily locate it on the home page; a suboptimal experience that the model helped ameliorate.

Row placement


To place the CW row appropriately on a member’s homepage, we would like to estimate the likelihood of the member being in a continuation mode vs. a discovery mode. With that likelihood we could take different approaches. A simple approach would be to turn row placement into a binary decision problem where we consider only two candidate positions for the CW row: one position high on the page and another one lower down. By applying a threshold on the estimated likelihood of continuation, we can decide in which of these two positions to place the CW row. That threshold could be tuned to optimize some accuracy metrics. Another approach is to take the likelihood and then map it onto different positions, possibly based on the content at that location on the page. In any case, getting a good estimate of the continuation likelihood is critical for determining the row placement. In the following, we discuss two potential approaches for estimating the likelihood of the member operating in a continuation mode.

Reusing the show-ranking model


A simple approach to estimating the likelihood of continuation vs. discovery is to reuse the scores predicted by the show-ranking model. More specifically, we could calibrate the scores of individual shows in order to estimate the probability P(play(s)=1) that each show s will be resumed in the given session. We can use these individual probabilities over all the shows in the CW row to obtain an overall probability of continuation; i.e., the probability that at least one show from the CW row will be resumed. For example, under a simple assumption of independence of different plays, we can write the probability that at least one show from the CW row will be played as:

Dedicated row model


In this approach, we train a binary classifier to differentiate between continuation sessions as positive labels and sessions where the user played a show for the first time (discovery sessions) as negative labels. Potential features for this model could include member-level and contextual features, as well as the interactions of the member with the most recent shows in the viewing history.
Comparing the two approaches, the first approach is simpler because it only requires having a single model as long as the probabilities are well calibrated. However, the second one is likely to provide a more accurate estimate of continuation because we can train a classifier specifically for it.

Tuning the placement


In our experiments, we evaluated our estimates of continuation likelihood using classification metrics and achieved good offline metrics. However, a challenge that still remains is to find an optimal mapping for that estimated likelihood, i.e., to balance continuation and discovery. In this case, varying the placement creates a trade-off between two types of errors in our prediction: false positives (where we incorrectly predict that the member wants to resume a show from the CW row) and false negatives (where we incorrectly predict that the member wants to discover new content). These two types of errors have different impacts on the member. In particular, a false negative makes it harder for members to continue bingeing on a show. While experienced members can find the show by scrolling down the page or by using the search functionality, the additional friction can make it more difficult for people new to the service. On the other hand, a false positive leads to wasted screen real estate, which could have been used to display more relevant recommendation shows for discovery. Since the impacts of the two types of errors on the member experience are difficult to measure accurately offline, we A/B tested different placement mappings and were able to learn the appropriate value from online experiments leading to the highest member engagement.

Context Awareness


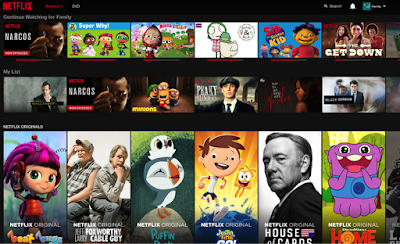
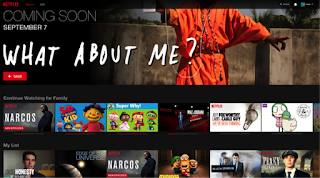
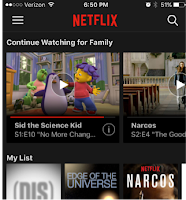
One of our hypotheses was that continuation behavior depends on context: time, location, device, etc. If that is the case, given proper features, the trained models should be able to detect those patterns and adapt the predicted probability of resuming shows based on the current context of a member. For example, members may have habits of watching a certain show around the same time of the day (for example, watching comedies at around 10 PM on weekdays). As an example of context awareness, the following screenshots demonstrate how the model uses contextual features to distinguish between the behavior of a member on different devices. In this example, the profile has just watched a few minutes of the show “Sid the Science Kid” on an iPhone and the show “Narcos” on the Netflix website. In response, the CW model immediately ranks “Sid the Science Kid” at the top position of the CW row on the iPhone, and puts “Narcos” at the first position on the website.


Serving the Row

Members expect the CW row to be responsive and change dynamically after they watch a show. Moreover, some of the features in the model are time and device dependent and can not be precomputed in advance, which is an approach we use for some of our recommendation systems. Therefore, we need to compute the CW row in real-time to make sure it is fresh when we get a request for a homepage at the start of a session. To keep it fresh, we also need to update it within a session after certain user interactions and immediately push that update to the client to update their homepage. Computing the row on-the-fly at our scale is challenging and requires careful engineering. For example, some features are more expensive to compute for the users with longer viewing history, but we need to have reasonable response times for all members because continuation is a very common scenario. We collaborated with several engineering teams to create a dynamic and scalable way for serving the row to address these challenges.

Conclusion

Having a better Continue Watching row clearly makes it easier for our members to jump right back into the content they are enjoying while also getting out of the way when they want to discover something new. While we’ve taken a few steps towards improving this experience, there are still many areas for improvement. One challenge is that we seek to unify how we place this row with respect to the rest of the rows on the homepage, which are predominantly focused on discovery. This is challenging because different algorithms are designed to optimize for different actions, so we need a way to balance them. We also want to be thoughtful about pushing CW too much; we want people to “Binge Responsibly” and also explore new content. We also have details to dig into like how to determine if a show is actually finished by a user so we can remove it from the row. This can be complicated by scenarios such as if someone turned off their TV but not the playing device or fell asleep watching. We also keep an eye out for new ways to use the CW model in other aspects of the product.
Can’t wait to see how the Netflix Recommendation saga continues? Join us in tackling these kinds of algorithmic challenges and help write the next episode.


Netflix Chaos Monkey Upgraded

$
0
0

We are pleased to announce a significant upgrade to one of our more popular OSS projects.  Chaos Monkey 2.0 is now on github!

Years ago, we decided to improve the resiliency of our microservice architecture.  At our scale it is guaranteed that servers on our cloud platform will sometimes suddenly fail or disappear without warning.  If we don’t have proper redundancy and automation, these disappearing servers could cause service problems.

The Freedom and Responsibility culture at Netflix doesn’t have a mechanism to force engineers to architect their code in any specific way.  Instead, we found that we could build strong alignment around resiliency by taking the pain of disappearing servers and bringing that pain forward.  We created Chaos Monkey to randomly choose servers in our production environment and turn them off during business hours.  Some people thought this was crazy, but we couldn’t depend on the infrequent occurrence to impact behavior.  Knowing that this would happen on a frequent basis created strong alignment among our engineers to build in the redundancy and automation to survive this type of incident without any impact to the millions of Netflix members around the world.

We value Chaos Monkey as a highly effective tool for improving the quality of our service.  Now Chaos Monkey has evolved.  We rewrote the service for improved maintainability and added some great new features.  The evolution of Chaos Monkey is part of our commitment to keep our open source software up to date with our current environment and needs.

Integration with Spinnaker

Chaos Monkey 2.0 is fully integrated with Spinnaker, our continuous delivery platform.
Service owners set their Chaos Monkey configs through the Spinnaker apps, Chaos Monkey gets information about how services are deployed from Spinnaker, and Chaos Monkey terminates instances through Spinnaker.

Since Spinnaker works with multiple cloud backends, Chaos Monkey does as well. In the Netflix environment, Chaos Monkey terminates virtual machine instances running on AWS and Docker containers running on Titus, our container cloud.

Integration with Spinnaker gave us the opportunity to improve the UX as well.  We interviewed our internal customers and came up with a more intuitive method of scheduling terminations.  Service owners can now express a schedule in terms of the mean time between terminations, rather than a probability over an arbitrary period of time.  We also added grouping by app, stack, or cluster, so that applications that have different redundancy architectures can schedule Chaos Monkey appropriate to their configuration. Chaos Monkey now also supports specifying exceptions so users can opt out specific clusters.  Some engineers at Netflix use this feature to opt out small clusters that are used for testing.

Chaos Monkey Spinnaker UI
Tracking Terminations

Chaos Monkey can now be configured for specifying trackers.  These external services will receive a notification when Chaos Monkey terminates an instance.  Internally, we use this feature to report metrics into Atlas, our telemetry platform, and Chronos, our event tracking system.  The graph below, taken from Atlas UI, shows the number of Chaos Monkey terminations for a segment of our service.  We can see chaos in action.  Chaos Monkey even periodically terminates itself.

Chaos Monkey termination metrics in Atlas
Termination Only

Netflix only uses Chaos Monkey to terminate instances.  Previous versions of Chaos Monkey allowed the service to ssh into a box and perform other actions like burning up CPU, taking disks offline, etc.  If you currently use one of the prior versions of Chaos Monkey to run an experiment that involves anything other than turning off an instance, you may not want to upgrade since you would lose that functionality.

Finale

We also used this opportunity to introduce many small features such as automatic opt-out for canaries, cross-account terminations, and automatic disabling during an outage.  Find the code on the Netflix github account and embrace the chaos!

-Chaos Engineering Team at Netflix
Lorin Hochstein, Casey Rosenthal

Netflix at RecSys 2016 - Recap

$
0
0

A key aspect of Netflix is providing our members with a personalized experience so they can easily find great stories to enjoy. A collection of recommender systems drive the main aspects of this personalized experience and we continuously work on researching and testing new ways to make them better. As such, we were delighted to sponsor and participate in this year’s ACM Conference on Recommender Systems in Boston, which marked the 10th anniversary of the conference. For those who couldn’t attend or want more information, here is a recap of our talks and papers at the conference.

Justin and Yves gave a talk titled “Recommending for the World” on how we prepared our algorithms to work world-wide ahead of our global launch earlier this year. You can also read more about it in our previous blogposts.


Justin also teamed up with Xavier Amatriain, formerly at Netflix and now at Quora, in the special Past, Present, and Future track to offer an industry perspective on what the future of recommender systems in industry may be.


Chao-Yuan Wu presented a paper he authored last year while at Netflix, on how to use navigation information to adapt recommendations within a session as you learn more about user intent.


Yves also shared some pitfalls of distributed learning at the Large Scale Recommender Systems workshop.


Hossein Taghavi gave a presentation at the RecSysTV workshop on trying to balance discovery and continuation in recommendations, which is also the subject of a recent blog post.


Dawen Liang presented some research he conducted prior to joining Netflix on combining matrix factorization and item embedding.


If you are interested in pushing the frontier forward in the recommender systems space, take a look at some of our relevant open positions!

Netflix at AWS re:Invent 2016

$
0
0
Like many of our tech blog readers, Netflix is getting ready for AWS re:Invent in Las Vegas next week. Lots of Netflix engineers and recruiters will be in attendance, and we're looking forward to meeting and reconnecting with cloud enthusiasts and Netflix OSS users.

To make it a little easier to find our speakers at re:Invent, we're posting the schedule of Netflix talks here. We'll also have a booth on the expo floor and hope to see you there!

AES119 - Boosting Your Developers Productivity and Efficiency by Moving to a Container-Based Environment with Amazon ECS
Wednesday, November 30 3:40pm (Executive Summit)
Neil Hunt, Chief Product Officer

Abstract: Increasing productivity and encouraging more efficient ways for development teams to work is top of mind for nearly every IT leader. In this session, Neil Hunt, Chief Product Officer at Netflix, will discuss why the company decided to introduce a container-based approach in order to speed development time, improve resource utilization, and simplify the developer experience. Learn about the company’s technical and business goals, technology choices and tradeoffs it had to make, and benefits of using Amazon ECS.

ARC204 - From Resilience to Ubiquity - #NetflixEverywhere Global Architecture
Tuesday, November 29 9:30am
Thursday, December 1 12:30pm
Coburn Watson, Director, Performance and Reliability

Abstract: Building and evolving a pervasive, global service requires a multi-disciplined approach that balances requirements with service availability, latency, data replication, compute capacity, and efficiency. In this session, we’ll follow the Netflix journey of failure, innovation, and ubiquity. We'll review the many facets of globalization and then delve deep into the architectural patterns that enable seamless, multi-region traffic management; reliable, fast data propagation; and efficient service infrastructure. The patterns presented will be broadly applicable to internet services with global aspirations.

BDM306 - Netflix: Using Amazon S3 as the fabric of our big data ecosystem
Tuesday, November 29, 5:30pm
Wednesday, November 30, 12:30pm
Eva Tse, Director, Big Data Platform
Kurt Brown, Director, Data Platform

Abstract: Amazon S3 is the central data hub for Netflix's big data ecosystem. We currently have over 1.5 billion objects and 60+ PB of data stored in S3. As we ingest, transform, transport, and visualize data, we find this data naturally weaving in and out of S3. Amazon S3 provides us the flexibility to use an interoperable set of big data processing tools like Spark, Presto, Hive, and Pig. It serves as the hub for transporting data to additional data stores / engines like Teradata, Redshift, and Druid, as well as exporting data to reporting tools like Microstrategy and Tableau. Over time, we have built an ecosystem of services and tools to manage our data on S3. We have a federated metadata catalog service that keeps track of all our data. We have a set of data lifecycle management tools that expire data based on business rules and compliance. We also have a portal that allows users to see the cost and size of their data footprint. In this talk, we’ll dive into these major uses of S3, as well as many smaller cases, where S3 smoothly addresses an important data infrastructure need. We will also provide solutions and methodologies on how you can build your own S3 big data hub.

CON313 - Netflix: Container Scheduling, Execution, and Integration with AWS
Thursday, December 1, 2:00pm
Andrew Spyker, Manager, Netflix Container Cloud

Abstract: Members from over all over the world streamed over forty-two billion hours of Netflix content last year. Various Netflix batch jobs and an increasing number of service applications use containers for their processing. In this session, Netflix presents a deep dive on the motivations and the technology powering container deployment on top of Amazon Web Services. The session covers our approach to resource management and scheduling with the open source Fenzo library, along with details of how we integrate Docker and Netflix container scheduling running on AWS. We cover the approach we have taken to deliver AWS platform features to containers such as IAM roles, VPCs, security groups, metadata proxies, and user data. We want to take advantage of native AWS container resource management using Amazon ECS to reduce operational responsibilities. We are delivering these integrations in collaboration with the Amazon ECS engineering team. The session also shares some of the results so far, and lessons learned throughout our implementation and operations.

DEV209 - Another Day in the Life of a Netflix Engineer
Wednesday, November 30, 4:00pm
Dave Hahn, Senior SRE

Abstract: Netflix is big. Really big. You just won't believe how vastly, hugely, mind-bogglingly big it is. Netflix is a large, ever changing, ecosystem system serving million of customers across the globe through cloud-based systems and a globally distributed CDN. This entertaining romp through the tech stack serves as an introduction to how we think about and design systems, the Netflix approach to operational challenges, and how other organizations can apply our thought processes and technologies. We’ll talk about: 
  • The Bits - The technologies used to run a global streaming company 
  • Making the Bits Bigger - Scaling at scale 
  • Keeping an Eye Out - Billions of metrics 
  • Break all the Things - Chaos in production is key 
  • DevOps - How culture affects your velocity and uptime

DEV311 - Multi-Region Delivery Netflix Style
Thursday, December 1, 1:00pm
Andrew Glover, Engineering Manager

Abstract: Netflix rapidly deploys services across multiple AWS accounts and regions over 4,000 times a day. We’ve learned many lessons about reliability and efficiency. What’s more, we’ve built sophisticated tooling to facilitate our growing global footprint. In this session, you’ll learn about how Netflix confidently delivers services on a global scale and how, using best practices combined with freely available open source software, you can do the same.

MBL204 - How Netflix Achieves Email Delivery at Global Scale with Amazon SES 
Tuesday, November 29, 10:00am
Devika Chawla, Engineering Director

Abstract: Companies around the world are using Amazon Simple Email Service (Amazon SES) to send millions of emails to their customers every day, and scaling linearly, at cost. In this session, you learn how to use the scalable and reliable infrastructure of Amazon SES. In addition, Netflix talks about their advanced Messaging program, their challenges, how SES helped them with their goals, and how they architected their solution for global scale and deliverability.

NET304 - Moving Mountains: Netflix's Migration into VPC
Thursday, December 1, 3:30pm
Andrew Braham, Manager, Cloud Network Engineering
Laurie Ferioli, Senior Program Manager

Abstract: Netflix was one of the earliest AWS customers with such large scale. By 2014, we were running hundreds of applications in Amazon EC2. That was great, until we needed to move to VPC. Given our scale, uptime requirements, and the decentralized nature of how we manage our production environment, the VPC migration (still ongoing) presented particular challenges for us and for AWS as it sought to support our move. In this talk, we discuss the starting state, our requirements and the operating principles we developed for how we wanted to drive the migration, some of the issues we ran into, and how the tight partnership with AWS helped us migrate from an EC2-Classic platform to an EC2-VPC platform.

SAC307 - The Psychology of Security Automation
Thursday, December 1, 12:30pm
Friday, December 2, 11:00am
Jason Chan, Director, Cloud Security

Abstract: Historically, relationships between developers and security teams have been challenging. Security teams sometimes see developers as careless and ignorant of risk, while developers might see security teams as dogmatic barriers to productivity. Can technologies and approaches such as the cloud, APIs, and automation lead to happier developers and more secure systems? Netflix has had success pursuing this approach, by leaning into the fundamental cloud concept of self-service, the Netflix cultural value of transparency in decision making, and the engineering efficiency principle of facilitating a “paved road.”

This session explores how security teams can use thoughtful tools and automation to improve relationships with development teams while creating a more secure and manageable environment. Topics include Netflix’s approach to IAM entity management, Elastic Load Balancing and certificate management, and general security configuration monitoring.

STG306 - Tableau Rules of Engagement in the Cloud
Thursday, December 1, 1:00pm
Srikanth Devidi, Senior Data Engineer
Albert Wong, Enterprise Reporting Platform Manager

Abstract: You have billions of events in your fact table, all of it waiting to be visualized. Enter Tableau… but wait: how can you ensure scalability and speed with your data in Amazon S3, Spark, Amazon Redshift, or Presto? In this talk, you’ll hear how Albert Wong and Srikanth Devidi at Netflix use Tableau on top of their big data stack. Albert and Srikanth also show how you can get the most out of a massive dataset using Tableau, and help guide you through the problems you may encounter along the way. 

More Efficient Mobile Encodes for Netflix Downloads

$
0
0

Last January, Netflix launched globally, reaching many new members in 130 countries around the world. In many of these countries, people access the internet primarily using cellular networks or still-developing broadband infrastructure. Although we have made strides in delivering the same or better video quality with less bits (for example, with per-title encode optimization), further innovation is required to improve video quality over low-bandwidth unreliable networks. In this blog post, we summarize our recent work on generating more efficient video encodes, especially targeted towards low-bandwidth Internet connections. We refer to these new bitstreams as our mobile encodes.

Our first use case for these streams is the recently launched downloads feature on Android and iOS.

What’s new about our mobile encodes

We are introducing two new types of mobile encodes - AVCHi-Mobile and VP9-Mobile. The enhancements in the new bitstreams fall into three categories: (1) new video compression formats, (2) more optimal encoder settings, and (3) per-chunk bitrate optimization. All the changes combined result in better video quality for the same bitrate compared to our current streams (AVCMain).

New compression formats

Many Netflix-ready devices receive streams which are encoded using the H.264/AVC Main profile (AVCMain). This is a widely-used video compression format, with ubiquitous decoder support on web browsers, TVs, mobile devices, and other consumer devices. However, newer formats are available that offer more sophisticated video coding tools. For our mobile bitstreams we adopt two compression formats: H.264/AVC High profile and VP9 (profile 0). Similar to Main profile, the High profile of H.264/AVCenjoys broad decoder support. VP9, a royalty-free format developed by Google, is supported on the majority of Android devices, Chrome, and a growing number of consumer devices.

High profile of H.264/AVC shares the general architecture of H.264/AVC Main profile and among other features, offers other tools that increase compression efficiency. The tools from High profile that are relevant to our use case are:
  • 8x8 transforms and Intra 8x8 prediction
  • Quantization scaling matrices
  • Separate Cb and Cr control

VP9 has a number of tools which bring improvements in compression efficiency over H.264/AVC, including:
  • Motion-predicted blocks of sizes up to 64×64
  • 1/8th pel motion vectors
  • Three switchable 8-tap subpixel interpolation filters
  • Better coding of motion vectors
  • Larger discrete cosine transforms (DCT, 16×16, and 32×32)
  • Asymmetric discrete sine transform (ADST)
  • Loop filtering adapted to new block sizes
  • Segmentation maps

More optimal encoder settings

Apart from using new coding formats, optimizing encoder settings allows us to further improve compression efficiency. Examples of improved encoder settings are as follows:
  • Increased random access picture period: This parameter trades off encoding efficiency with granularity of random access points.
  • More consecutive B-frames or longer Alt-ref distance: Allowing the encoder to flexibly choose more B-frames in H.264/AVC or longer distance between Alt-ref frames in VP9 can be beneficial, especially for slowly changing scenes.
  • Larger motion search range: Results in better motion prediction and fewer intra-coded blocks.
  • More exhaustive mode evaluation: Allows an encoder to evaluate more encoding options at the expense of compute time.

Per-chunk encode optimization

In our parallel encoding pipeline, the video source is split up into a number of chunks, each of which is processed and encoded independently. For our AVCMain encodes, we analyze the video source complexity to select bitrates and resolutions optimized for that title. Whereas our AVCMain encodes use the same average bitrate for each chunk in a title, the mobile encodes optimize the bitrate for each individual chunk based on its complexity (in terms of motion, detail, film grain, texture, etc). This reduces quality fluctuations between the chunks and avoids over-allocating bits to chunks with less complex content.

Video compression results

In this section, we evaluate the compression performance of our new mobile encodes. The following configurations are compared:
  • AVCMain:  Our existing H.264/AVC Main profile encodes, using per-title optimization, serve asanchorforthecomparison.
  • AVCHi-Mobile: H.264/AVC High profile encodes using more optimal encoder settings and per-chunk encoding.  
  • VP9-Mobile: VP9 encodes using more optimal encoder settings and per-chunk encoding.

The results were obtained on a sample of 600 full-length popular movies or TV episodes with 1080p source resolution (which adds up to about 85 million frames). We encode multiple quality points (with different resolutions), to account for different bandwidth conditions of our members.

In our tests, we calculate PSNR and VMAF to measure video quality.  The metrics are  computed after scaling the decoded videos to the original 1080p source resolution. To compare the average compression efficiency improvement, we use Bjontegaard-delta rate (BD-rate), a measure widely used in video compression. BD-rate indicates the average change in bitrate that is needed for a tested configuration to achieve the same quality as the anchor. The metric is calculated over a range of bitrate-quality points and interpolates between them to get an estimate of the relative performance of two configurations.

The graph below illustrates the results of the comparison. The bars represent BD-rate gains, and higher percentages indicate larger bitrate savings.The AVCHi-Mobile streams can deliver the same video quality at 15% lower bitrate according to PSNR and at 19% lower bitrate according to VMAF. The VP9-Mobile streams show more gains and can deliver an average of 36% bitrate savings according to PSNR and VMAF. This demonstrates that using the new mobile encodes requires significantly less bitrate for the same quality.


Viewing it another way, members can now receive better quality streams for the same bitrate. This is especially relevant for members with slow or expensive internet connectivity. The graph below illustrates the average quality (in terms of VMAF) at different available bit budgets for the video bitstream. For example, at 1 Mbps, our AVCHi-Mobile and VP9-Mobile streams show an average VMAF increase of 7 and 10, respectively, over AVC-Main. These gains represent noticeably better visual quality for the mobile streams.


How can I watch with the new mobile encodes?

Last month, we started re-encoding our catalog to generate the new mobile bitstreams and the effort is ongoing. The mobile encodes are being used in the brand new downloads feature. In the near future, we will also use these new bitstreams for mobile streaming to broaden the benefit for Netflix members, no matter how they’re watching.


By Andrey Norkin, Jan De Cock, Aditya Mavlankar and Anne Aaron

NetflixOSS: Announcing Hollow

$
0
0
“If you can cache everything in a very efficientway,
you can often change the game”

We software engineers often face problems that require the dissemination of a dataset which doesn’t fit the label “big data”.  Examples of this type of problem include:

  • Product metadata on an ecommerce site
  • Document metadata in a search engine
  • Metadata about movies and TV shows on an Internet television network

When faced with these we usually opt for one of two paths:

  • Keep the data in a centralized location (e.g. an RDBMS, nosql data store, or memcached cluster) for remote access by consumers
  • Serialize it (e.g. as json, XML, etc) and disseminate it to consumers which keep a local copy

Scaling each of these paths presents different challenges. Centralizing the data may allow your dataset to grow indefinitely large, but:

  • There are latency and bandwidth limitations when interacting with the data
  • A remote data store is never quite as reliable as a local copy of the data

On the other hand, serializing and keeping a local copy of the data entirely in RAM can allow many orders of magnitude lower latency and higher frequency access, but this approach has scaling challenges that get more difficult as a dataset grows in size:

  • The heap footprint of the dataset grows
  • Retrieving the dataset requires downloading more bits
  • Updating the dataset may require significant CPU resources or impact GC behavior

Engineers often select a hybrid approach — cache the frequently accessed data locally and go remote for the “long-tail” data.  This approach has its own challenges:

  • Bookkeeping data structures can consume a significant amount of the cache heap footprint
  • Objects are often kept around just long enough for them to be promoted and negatively impact GC behavior

At Netflix we’ve realized that this hybrid approach often represents a false savings.  Sizing a local cache is often a careful balance between the latency of going remote for many records and the heap requirement of keeping more data local.  However, if you can cache everything in a very efficient way, you can often change the game — and get your entire dataset in memory using less heap and CPU than you would otherwise require to keep just a fraction of it.  This is where Hollow, Netflix’s latest OSS project comes in.


logo.png


Hollow is a java library and comprehensive toolset for harnessing small to moderately sized in-memory datasets which are disseminated from a single producer to many consumers for read-only access.

“Hollow shifts the scale
datasets for which such liberation
may never previously have been considered
can be candidates for Hollow.”


Performance

Hollow focuses narrowly on its prescribed problem set: keeping an entire, read-only dataset in-memory on consumers.  It circumvents the consequences of updating and evicting data from a partial cache.

Due to its performance characteristics, Hollow shifts the scale in terms of appropriate dataset sizes for an in-memory solution. Datasets for which such liberation may never previously have been considered can be candidates for Hollow.  For example, Hollow may be entirely appropriate for datasets which, if represented with json or XML, might require in excess of 100GB.

Agility

Hollow does more than simply improve performance it also greatly enhances teams’ agility when dealing with data related tasks.

Right from the initial experience, using Hollow is easy.  Hollow will automatically generate a custom API based on a specific data model, so that consumers can intuitively interact with the data, with the benefit of IDE code completion.

But the real advantages come from using Hollow on an ongoing basis.  Once your data is Hollow, it has more potential.  Imagine being able to quickly shunt your entire production dataset current or from any point in the recent past down to a local development workstation, load it, then exactly reproduce specific production scenarios.  

Choosing Hollow will give you a head start on tooling; Hollow comes with a variety of ready-made utilities to provide insight into and manipulate your datasets.

Stability

How many nines of reliability are you after?  Three, four, five?  Nine?  As a local in-memory data store, Hollow isn’t susceptible to environmental issues, including network outages, disk failures, noisy neighbors in a centralized data store, etc.  If your data producer goes down or your consumer fails to connect to the data store, you may be operating with stale data but the data is still present and your service is still up.

Hollow has been battle-hardened over more than two years of continuous use at Netflix. We use it to represent crucial datasets, essential to the fulfillment of the Netflix experience, on servers busily serving live customer requests at or near maximum capacity.  Although Hollow goes to extraordinary lengths to squeeze every last bit of performance out of servers’ hardware, enormous attention to detail has gone into solidifying this critical piece of our infrastructure.

Origin

Three years ago we announced Zeno, our then-current solution in this space.  Hollow replaces Zeno but is in many ways its spiritual successor.
deltachain.gif
Zeno’s concepts of producer, consumers, data states, snapshots and deltas are carried forward into Hollow

As before, the timeline for a changing dataset can be broken down into discrete data states, each of which is a complete snapshot of the data at a particular point in time.  Hollow automatically produces deltas between states; the effort required on the part of consumers to stay updated is minimized.  Hollow deduplicates data automatically to minimize the heap footprint of our datasets on consumers.

Evolution

Hollow takes these concepts and evolves them, improving on nearly every aspect of the solution.  

Hollow eschews POJOs as an in-memory representation instead replacing them with a compact, fixed-length, strongly typed encoding of the data.  This encoding is designed to both minimize a dataset’s heap footprint and to minimize the CPU cost of accessing data on the fly.  All encoded records are packed into reusable slabs of memory which are pooled on the JVM heap to avoid impacting GC behavior on busy servers.

memlayout-object.png
An example of how OBJECT type records are laid out in memory

Hollow datasets are self-containedno use-case specific code needs to accompany a serialized blob in order for it to be usable by the framework.  Additionally, Hollow is designed with backwards compatibility in mind so deployments can happen less frequently.  

“Allowing for the construction of
powerful access patterns, whether
or not they were originally anticipated
while designing the data model.”

Because Hollow is all in-memory, tooling can be implemented with the assumption that random access over the entire breadth of the dataset can be accomplished without ever leaving the JVM heap.  A multitude of prefabricated tools ship with Hollow, and creation of your own tools using the basic building blocks provided by the library is straightforward.

Core to Hollow’s usage is the concept of indexing the data in various ways.  This enables O(1) access to relevant records in the data, allowing for the construction of powerful access patterns, whether or not they were originally anticipated while designing the data model.

Benefits

Tooling for Hollow is easy to set up and intuitive to understand.  You’ll be able to gain insights into your data about things you didn’t know you were unaware of.

The history tool allows for inspecting the changes in specific records over time

Hollow can make you operationally powerful.  If something looks wrong about a specific record, you can pinpoint exactly what changed and when it happened with a simple query into the history tool.  If disaster strikes and you accidentally publish a bad dataset, you can roll back your dataset to just before the error occurred, stopping production issues in their tracks.  Because transitioning between states is fast, this action can take effect across your entire fleet within seconds.

“Once your data is Hollow, it has more potential.”

Hollow has been enormously beneficial at Netflix we've seen server startup times and heap footprints decrease across the board in the face of ever-increasing metadata needs.  Due to targeted data modeling efforts identified through detailed heap footprint analysis made possible by Hollow, we will be able to continue these performance improvements.

In addition to performance wins, we've seen huge productivity gains related to the dissemination of our catalog data.  This is due in part to the tooling that Hollow provides, and in part due to architectural choices which would not have been possible without it.

Conclusion

Everywhere we look, we see a problem that can be solved with Hollow.  Today, Hollow is available for the whole world to take advantage of.  

Hollow isn’t appropriate for datasets of all sizes.  If the data is large enough, keeping the entire dataset in memory isn’t feasible.  However, with the right framework, and a little bit of data modeling, that threshold is likely much higher than you think.

Documentation is available at http://hollow.how, and the code is available on GitHub.  We recommend diving into the quick start guide— you’ll have a demo up and running in minutes, and a fully production-scalable implementation of Hollow at your fingertips in about an hour.  From there, you can plug in your data model and it’s off to the races.

Once you get started, you can get help from us directly or from other users via Gitter, or by posting to Stack Overflow with the tag “hollow”.

By Drew Koszewnik

Netflix Conductor : A microservices orchestrator

$
0
0
The Netflix Content Platform Engineering team runs a number of business processes which are driven by asynchronous orchestration of tasks executing on microservices.  Some of these are long running processes spanning several days. These processes play a critical role in getting titles ready for streaming to our viewers across the globe.

A few examples of these processes are:

  • Studio partner integration for content ingestion
  • IMF based content ingestion from our partners
  • Process of setting up new titles within Netflix
  • Content ingestion, encoding, and deployment to CDN

Traditionally, some of these processes had been orchestrated in an ad-hoc manner using a combination of pub/sub, making direct REST calls, and using a database to manage the state.  However, as the number of microservices grow and the complexity of the processes increases, getting visibility into these distributed workflows becomes difficult without a central orchestrator.

We built Conductor “as an orchestration engine” to address the following requirements, take out the need for boilerplate in apps, and provide a reactive flow :

  • Blueprint based. A JSON DSL based blueprint defines the execution flow.
  • Tracking and management of workflows.
  • Ability to pause, resume and restart processes.
  • User interface to visualize process flows.
  • Ability to synchronously process all the tasks when needed.
  • Ability to scale to millions of concurrently running process flows.
  • Backed by a queuing service abstracted from the clients.
  • Be able to operate over HTTP or other transports e.g. gRPC.

Conductor was built to serve the above needs and has been in use at Netflix for almost a year now. To date, it has helped orchestrate more than 2.6 million process flows ranging from simple linear workflows to very complex dynamic workflows that run over multiple days.

Today, we are open sourcing Conductor to the wider community hoping to learn from others with similar needs and enhance its capabilities.  You can find the developer documentation for Conductor here.

Why not peer to peer choreography?

With peer to peer task choreography, we found it was harder to scale with growing business needs and complexities.  Pub/sub model worked for simplest of the flows, but quickly highlighted some of the issues associated with the approach:
  • Process flows are “embedded” within the code of multiple applications
  • Often, there is tight coupling and assumptions around input/output, SLAs etc, making it harder to adapt to changing needs
  • Almost no way to systematically answer “What is remaining for a movie's setup to be complete”?

Why Microservices?

In a microservices world, a lot of business process automations are driven by orchestrating across services. Conductor enables orchestration across services while providing control and visibility into their interactions. Having the ability to orchestrate across  microservices also helped us in leveraging existing services to build new flows or update existing flows to use Conductor very quickly, effectively providing an easier route to adoption.  

Architectural Overview


At the heart of the engine is a state machine service aka Decider service. As the workflow events occur (e.g. task completion, failure etc.), Decider combines the workflow blueprint with the current state of the workflow, identifies the next state, and schedules appropriate tasks and/or updates the status of the workflow.

Decider works with a distributed queue to manage scheduled tasks.  We have been using dyno-queues on top of Dynomite for managing distributed delayed queues. The queue recipe was open sourced earlier this year and hereis the blog post.

Task Worker Implementation

Tasks, implemented by worker applications, communicate via the API layer. Workers achieve this by either implementing a REST endpoint that can be called by the orchestration engine or by implementing a polling loop that periodically checks for pending tasks. Workers are intended to be idempotent stateless functions. The polling model allows us to handle backpressure on the workers and provide auto-scalability based on the queue depth when possible. Conductor provides APIs to inspect the workload size for each worker that can be used to autoscale worker instances.


Worker communication with the engine

API Layer

The APIs are exposed over HTTP - using HTTP allows for ease of integration with different clients. However, adding another protocol (e.g. gRPC) should be possible and relatively straightforward.

Storage

We use Dynomite“as a storage engine” along with Elasticsearch for indexing the execution flows. The storage APIs are pluggable and can be adapted for various storage systems including traditional RDBMSs or Apache Cassandra like no-sql stores.

Key Concepts

Workflow Definition

Workflows are defined using a JSON based DSL.  A workflow blueprint defines a series of tasks that needs be executed.  Each of the tasks are either a control task (e.g. fork, join, decision, sub workflow, etc.) or a worker task.  Workflow definitions are versioned providing flexibility in managing upgrades and migration.

An outline of a workflow definition:
{
 "name": "workflow_name",
 "description": "Description of workflow",
 "version": 1,
 "tasks": [
   {
     "name": "name_of_task",
     "taskReferenceName": "ref_name_unique_within_blueprint",
     "inputParameters": {
       "movieId": "${workflow.input.movieId}",
       "url": "${workflow.input.fileLocation}"
     },
     "type": "SIMPLE",
     ... (any other task specific parameters)
   },
   {}
   ...
 ],
 "outputParameters": {
   "encoded_url": "${encode.output.location}"
 }
}

Task Definition

Each task’s behavior is controlled by its template known as task definition. A task definition provides control parameters for each task such as timeouts, retry policies etc. A task can be a worker task implemented by application or a system task that is executed by orchestration server.  Conductor provides out of the box system tasks such as Decision, Fork, Join, Sub Workflows, and an SPI that allows plugging in custom system tasks. We have added support for HTTP tasks that facilitates making calls to REST services.

JSON snippet of a task definition:
{
 "name": "encode_task",
 "retryCount": 3,
 "timeoutSeconds": 1200,
 "inputKeys": [
   "sourceRequestId",
   "qcElementType"
 ],
 "outputKeys": [
   "state",
   "skipped",
   "result"
 ],
 "timeoutPolicy": "TIME_OUT_WF",
 "retryLogic": "FIXED",
 "retryDelaySeconds": 600,
 "responseTimeoutSeconds": 3600
}

Inputs / Outputs

Input to a task is a map with inputs coming as part of the workflow instantiation or output of some other task. Such configuration allows for routing inputs/outputs from workflow or other tasks as inputs to tasks that can then act upon it. For example, the output of an encoding task can be provided to a publish task as input to deploy to CDN.

JSON snippet for defining task inputs:
{
     "name": "name_of_task",
     "taskReferenceName": "ref_name_unique_within_blueprint",
     "inputParameters": {
       "movieId": "${workflow.input.movieId}",
       "url": "${workflow.input.fileLocation}"
     },
     "type": "SIMPLE"
   }

An Example

Let’s look at a very simple encode and deploy workflow:


There are a total of 3 worker tasks and a control task (Errors) involved:

  1. Content Inspection: Checks the file at input location for correctness/completeness
  2. Encode: Generates a video encode
  3. Publish: Publishes to CDN

These three tasks are implemented by different workers which are polling for pending tasks using the task APIs. These are ideally idempotent tasks that operate on the input given to the task, performs work, and updates the status back.

As each task is completed, the Decider evaluates the state of the workflow instance against the blueprint (for the version corresponding to the workflow instance) and identifies the next set of tasks to be scheduled, or completes the workflow if all tasks are done.

UI

The UI is the primary mechanism of monitoring and troubleshooting workflow executions. The UI provides much needed visibility into the processes by allowing searches based on various parameters including input/output parameters, and provides a visual presentation of the blueprint, and paths it has taken, to better understand process flow execution. For each workflow instance, the UI provides details of each task execution with the following details:

  • Timestamps for when the task was scheduled, picked up by the worker and completed.
  • If the task has failed, the reason for failure.
  • Number of retry attempts
  • Host on which the task was executed.
  • Inputs provided to the task and output from the task upon completion.

Here’s a UI snippet from a kitchen sink workflow used to generate performance numbers:


Other solutions considered

Amazon SWF

We started with an early version using a simple workflow from AWS. However, we chose to build Conductor given some of the limitations with SWF:
  • Need for blueprint based orchestration, as opposed to programmatic deciders as required by SWF.
  • UI for visualization of flows.
  • Need for more synchronous nature of APIs when required (rather than purely message based)
  • Need for indexing inputs and outputs for workflow and tasks and ability to search workflows based on that.
  • Need to maintain a separate data store to hold workflow events to recover from failures, search etc.

Amazon Step Function
Recently announced AWS Step Functions added some of the features we were looking for in an orchestration engine. There is a potential for Conductor to adopt the states language to define workflows.

Some Stats

Below are some of the stats from the production instance we have been running for a little over a year now. Most of these workflows are used by content platform engineering in supporting various flows for content acquisition, ingestion and encoding.

Total Instances created YTD
2.6 Million
No. of distinct workflow definitions
100
No. of unique workers
190
Avg no. of tasks per workflow definition
6
Largest Workflow
48 tasks

Future considerations

  • Support for AWS Lambda (or similar) functions as tasks for serverless simple tasks.
  • Tighter integration with container orchestration frameworks that will allow worker instance auto-scalability.
  • Logging execution data for each task. We think this is a useful addition that helps in troubleshooting.
  • Ability to create and manage the workflow blueprints from the UI.
  • Support for states language.
If you like the challenges of building distributed systems and are interested in building the Netflix studio ecosystem and the content pipeline at scale, check out ourjob openings.

By Viren Baraiya, Vikram Singh


Netflix Now Supports Ultra HD 4K on Windows 10 with New Intel Core Processors

$
0
0
We're excited to bring Netflix support for Ultra HD 4K to Windows 10, making the vast catalog of Netflix TV shows and movies in 4K even more accessible for our members around the world to watch in the best picture quality.

For the last several years, we've been working with our partners across the spectrum of CE devices to add support for the richer visual experience of 4K.  Since launching on Smart TVs in 2014, many different devices can now play our 4K content, including Smart TVs, set top boxes and game consoles.  We are pleased to add Windows 10 and 7th Gen Intel® Core™ CPUs to that list.

Microsoft and Intel both did great work to enable 4K on their platforms.  Intel added support for new, more efficient codecs necessary to stream 4K as well as hardware-based content security in their latest CPUs.  Microsoft enhanced the Edge browser with the latest HTML5 video support and made it work beautifully with Intel's latest processors.  The sum total is an enriched Netflix experience. Thanks to Microsoft's Universal Windows Platform, our app for Windows 10 includes the same 4K support as the Edge browser.

As always, you can enjoy all of our movies and TV shows on all supported platforms. We are working hard with our partners to further expand device support of 4K. An increasing number of our Netflix originals are shot, edited, and delivered in this format, with more than 600 hours available to watch, such as Stranger Things, The Crown, Gilmore Girls: A Year in the Life and Marvel's Luke Cage.

By Matt Trunnell, Nick Eddy, and Greg Wallace-Freedman

Crafting a high-performance TV user interface using React

$
0
0

The Netflix TV interface is constantly evolving as we strive to figure out the best experience for our members. For example, after A/B testing, eye-tracking research, and customer feedback we recently rolled out video previews to help members make better decisions about what to watch. We’ve written before about how our TV application consists of an SDK installed natively on the device, a JavaScript application that can be updated at any time, and a rendering layer known as Gibbon. In this post we’ll highlight some of the strategies we’ve employed along the way to optimize our JavaScript application performance.

React-Gibbon

In 2015, we embarked on a wholesale rewrite and modernization of our TV UI architecture. We decided to use React because its one-way data flow and declarative approach to UI development make it easier to reason about our app. Obviously, we’d need our own flavor of React since at that time it only targeted the DOM. We were able to create a prototype that targeted Gibbon pretty quickly. This prototype eventually evolved into React-Gibbon and we began to work on building out our new React-based UI.

React-Gibbon’s API would be very familiar to anyone who has worked with React-DOM. The primary difference is that instead of divs, spans, inputs etc, we have a single “widget” drawing primitive that supports inline styling.

React.createClass({
   render() {
       return <Widget style={{ text: 'Hello World', textSize: 20 }} />;
   }
});

Performance is a key challenge

Our app runs on hundreds of different devices, from the latest game consoles like the PS4 Pro to budget consumer electronics devices with limited memory and processing power. The low-end machines we target can often have sub-GHz single core CPUs, low memory and limited graphics acceleration. To make things even more challenging, our JavaScript environment is an older non-JIT version of JavaScriptCore. These restrictions make super responsive 60fps experiences especially tricky and drive many of the differences between React-Gibbon and React-DOM.

Measure, measure, measure

When approaching performance optimization it’s important to first identify the metrics you will use to measure the success of your efforts. We use the following metrics to gauge overall application performance:

  • Key Input Responsiveness - the time taken to render a change in response to a key press
  • Time To Interactivity - the time to start up the app
  • Frames Per Second - the consistency and smoothness of our animations
  • Memory Usage


The strategies outlined below are primarily aimed at improving key input responsiveness. They were all identified, tested and measured on our devices and are not necessarily applicable in other environments. As with all “best practice” suggestions it is important to be skeptical and verify that they work in your environment, and for your use case. We started off by using profiling tools to identify what code paths were executing and what their share of the total render time was; this lead us to some interesting observations.

Observation: React.createElement has a cost

When Babel transpiles JSX it converts it into a number of React.createElement function calls which when evaluated produce a description of the next Component to render. If we can predict what the createElement function will produce, we can inline the call with the expected result at build time rather than at runtime.


// JSX
render() {
   return <MyComponent key='mykey' prop1='foo' prop2='bar' />;
}

// Transpiled
render() {
   return React.createElement(MyComponent, { key: 'mykey', prop1: 'foo', prop2: 'bar' });
}

// With inlining
render() {
   return {
       type: MyComponent,
       props: {
           prop1: 'foo',
           prop2: 'bar'
       },
       key: 'mykey'
   };
}


As you can see we have removed the cost of the createElement call completely, a triumph for the “can we just not?” school of software optimization.

We wondered whether it would be possible to apply this technique across our whole application and avoid calling createElement entirely. What we found was that if we used a ref on our elements, createElement needs to be called in order to hook up the owner at runtime. This also applies if you’re using the spread operator which may contain a ref value (we’ll come back to this later).

We use a custom Babel plugin for element inlining, but there is an official plugin that you can use right now. Rather than an object literal, the official plugin will emit a call to a helper function that is likely to disappear thanks to the magic of V8 function inlining. After applying our plugin there were still quite a few components that weren’t being inlined, specifically Higher-order Components which make up a decent share of the total components being rendered in our app.

Problem: Higher-order Components can’t use Inlining

We love Higher-order Components (HOCs) as an alternative to mixins. HOCs make it easy to layer on behavior while maintaining a separation of concerns. We wanted to take advantage of inlining in our HOCs, but we ran into an issue: HOCs usually act as a pass-through for their props. This naturally leads to the use of the spread operator, which prevents the Babel plug-in from being able to inline.

When we began the process of rewriting our app, we decided that all interactions with the rendering layer would go through declarative APIs. For example, instead of doing:

componentDidMount() {
   this.refs.someWidget.focus()
}

In order to move application focus to a particular Widget, we instead implemented a declarative focus API that allows us to describe what should be focused during render like so:

render() {
   return <Widget focused={true} />;
}

This had the fortunate side-effect of allowing us to avoid the use of refs throughout the application. As a result we were able to apply inlining regardless of whether the code used a spread or not.


// before inlining
render() {
   return <MyComponent {...this.props} />;
}

// after inlining
render() {
   return {
       type: MyComponent,
       props: this.props
   };
}
This greatly reduced the amount of function calls and property merging that we were previously having to do but it did not eliminate it completely.

Problem: Property interception still requires a merge

After we had managed to inline our components, our app was still spending a lot of time merging properties inside our HOCs. This was not surprising, as HOCs often intercept incoming props in order to add their own or change the value of a particular prop before forwarding on to the wrapped component.

We did analysis of how stacks of HOCs scaled with prop count and component depth on one of our devices and the results were informative.


Screenshot 2017-01-11 12.31.30.png


They showed that there is a roughly linear relationship between the number of props moving through the stack and the render time for a given component depth.

Death by a thousand props

Based on our findings we realized that we could improve the performance of our app substantially by limiting the number of props passed through the stack. We found that groups of props were often related and always changed at the same time. In these cases, it made sense to group those related props under a single “namespace” prop. If a namespace prop can be modeled as an immutable value, subsequent calls to shouldComponentUpdate calls can be optimized further by checking referential equality rather than doing a deep comparison. This gave us some good wins but eventually we found that we had reduced the prop count as much as was feasible. It was now time to resort to more extreme measures.

Merging props without key iteration

Warning, here be dragons! This is not recommended and most likely will break many things in weird and unexpected ways.

After reducing the props moving through our app we were experimenting with other ways to reduce the time spent merging props between HOCs. We realized that we could use the prototype chain to achieve the same goals while avoiding key iteration.


// before proto merge
render() {
   const newProps = Object.assign({}, this.props, { prop1: 'foo' })
   return <MyComponent {...newProps} />;
}

// after proto merge
render() {
   const newProps = { prop1: 'foo' };
   newProps.__proto__ = this.props;
   return {
       type: MyComponent,
       props: newProps
   };
}

In the example above we reduced the 100 depth 100 prop case from a render time of ~500ms to ~60ms. Be advised that using this approach introduced some interesting bugs, namely in the event that this.props is a frozen object . When this happens the prototype chain approach only works if the __proto__ is assigned after the newProps object is created. Needless to say, if you are not the owner of newProps it would not be wise to assign the prototype at all.

Problem: “Diffing” styles was slow

Once React knows the elements it needs to render it must then diff them with the previous values in order to determine the minimal changes that must be applied to the actual DOM elements. Through profiling we found that this process was costly, especially during mount - partly due to the need to iterate over a large number of style properties.

Separate out style props based on what’s likely to change

We found that often many of the style values we were setting were never actually changed. For example, say we have a Widget used to display some dynamic text value. It has the properties text, textSize, textWeight and textColor. The text property will change during the lifetime of this Widget but we want the remaining properties to stay the same. The cost of diffing the 4 widget style props is spent on each and every render. We can reduce this by separating out the things that could change from the things that don't.

const memoizedStylesObject = { textSize: 20, textWeight: ‘bold’, textColor: ‘blue’ };


<Widget staticStyle={memoizedStylesObject} style={{ text: this.props.text }} />

If we are careful to memoize the memoizedStylesObject object, React-Gibbon can then check for referential equality and only diff its values if that check proves false. This has no effect on the time it takes to mount the widget but pays off on every subsequent render.

Why not avoid the iteration all together?

Taking this idea further, if we know what style props are being set on a particular widget, we can write a function that does the same work without having to iterate over any keys. We wrote a custom Babel plugin that performed static analysis on component render methods. It determines which styles are going to be applied and builds a custom diff-and-apply function which is then attached to the widget props.


// This function is written by the static analysis plugin
function __update__(widget, nextProps, prevProps) {
   var style = nextProps.style,
       prev_style = prevProps && prevProps.style;


   if (prev_style) {
       var text = style.text;
       if (text !== prev_style.text) {
           widget.text = text;
       }
   } else {
       widget.text = style.text;
   }
}


React.createClass({
   render() {
       return (
           <Widget __update__={__update__} style={{ text: this.props.title }}  />
       );
   }
});


Internally React-Gibbon looks for the presence of the “special” __update__ prop and will skip the usual iteration over previous and next style props, instead applying the properties directly to the widget if they have changed. This had a huge impact on our render times at the cost of increasing the size of the distributable.

Performance is a feature

Our environment is unique, but the techniques we used to identify opportunities for performance improvements are not. We measured, tested and verified all of our changes on real devices. Those investigations led us to discover a common theme: key iteration was expensive. As a result we set out to identify merging in our application, and determine whether they could be optimized. Here’s a list of some of the other things we’ve done in our quest to improve performance:

  • Custom Composite Component - hyper optimized for our platform
  • Pre-mounting screens to improve perceived transition time
  • Component pooling in Lists
  • Memoization of expensive computations

Building a Netflix TV UI experience that can run on the variety of devices we support is a fun challenge. We nurture a performance-oriented culture on the team and are constantly trying to improve the experiences for everyone, whether they use the Xbox One S, a smart TV or a streaming stick. Come join us if that sounds like your jam!


Coming Soon: Netflix Android Bootcamp

$
0
0
Mobile devices have had an incredible impact on people’s lives in the past few years and, as expected, Netflix members have embraced these devices for significant amounts of online video viewing. Just over a year ago, Netflix expanded from streaming in 60 countries to over 190 countries today. In many of our newer countries, mobile usage is outsized compared with other platforms. As Netflix has grown globally, we have a corresponding desire to invest more time and energy in creating great experiences on mobile.


Demand for Android engineers in the Bay Area has only increased over time and great mobile engineers are rare. To help develop great mobile talent, we’re excited to announce that we are sponsoring an upcoming Android bootcamp by CodePath. CodePath runs intensive training programs for practicing engineers who wish to develop knowledge and skill on a new platform (Android in this case).


We have chosen to partner with them for the following reasons:
  1. There are a number of CodePath graduates at Netflix who have demonstrated a thorough understanding of the new platform upon class completion. Each has testified to CodePath’s success as a challenging program that rapidly prepared them for mobile development.
  2. CodePath’s program requires a rigorous demonstration of aptitude and dedication. Both Netflix and CodePath seek excellence.
  3. The CodePath admissions process is blind to gender and race, creating a level playing field for people who are often underrepresented in tech. We share the goal of creating a diverse and inclusive environment for individuals from a variety of backgrounds.


There is no cost for participants to attend. For practicing software engineers, the primary requirement is dedicating your time and energy to learn a new platform. We aim to accept 15 engineers into the program on-site to keep the class size small. Additional seats will be available to remote students.


Sessions will be held at our headquarters in Los Gatos. Classes start March 6, 2017, continuing each Monday and Wednesday evening for 8 weeks. We look forward to having you there to develop your skills on this fun and exciting platform.


By Greg Benson, Android Innovation team

Netflix Hack Day - Winter 2017

$
0
0


We hosted another great Hack Day event a week ago at Netflix headquarters.  Hack Day is a way for our product development team to take a break from everyday work, have fun, experiment with new technologies, and collaborate with new people.


Each Hack Day, we see a wide range of ideas on how to improve the product and internal tools as well as some that are just meant to be fun.  This event was no different.   We’ve embedded videos below, produced by the hackers, to some of our favorites. You can also see more hacks from several of our past events:May 2016, November 2015,March 2015,Feb. 2014&Aug. 2014.


While we’re excited about the creativity and thought put into these hacks, they may never become part of the Netflix product, internal infrastructure, or otherwise be used beyond Hack Day.  We are posting them here publicly to share the spirit of the event and our culture of innovation.


Thanks again to the hackers who, in just 24 hours, assembled really innovative hacks.  


Stranger Bling

MDAS (Mobile Demogorgon Alerting System) a.k.a Ugly Christmas Sweater
LEDs soldered to a Stranger Things sweater, controlled wirelessly with an Arduino, spelling out messages from the Upside Down!


MindFlix

Navigate and control Netflix with your mind (with help from a Muse headband).


Netflix for Good

After watching socially conscious titles on Netflix, Netflix for Good allows users to donate to related and well known organizations from inside the Netflix app.


Stranger Games

Stranger Things re-imagined as a home console video game collection created back in 1983, but with a twist.


Picture in Picture

See what other profiles on your account are watching via picture in picture.

Introducing HubCommander

$
0
0
By Mike Grima, Andrew Spyker, and Jason Chan

Netflix is pleased to announce the open source release of HubCommander, a ChatOps tool for GitHub management.

Why HubCommander?

Netflix uses GitHub, a source code management and collaboration site, extensively for both open source and internal projects. The security model for GitHub does not permit users to perform repository management without granting administrative permissions. Management of many users on GitHub can be a challenge without tooling. We needed to provide enhanced security capabilities while maintaining developer agility. As such, we created HubCommander to provide these capabilities in a method optimized for Netflix.

Why ChatOps?

Our approach leverages ChatOps, which utilizes chat applications for performing operational tasks. ChatOps is increasingly popular amongst developers, since chat tools are ubiquitous, provide a single context for what actions occurred when and by whom, and also provides an effective means to provide self-serviceability to developers.

How Netflix leverages GitHub:

All Netflix owned GitHub repositories reside within multiple GitHub organizations. Organizations contain the git repositories and the users that maintain them. Users can be added into teams, and teams are given access to individual repositories. In this model, a GitHub user would get invited to an organization from an administrator. Once invited, the user becomes a member of the organization, and is placed into one or more teams.

At Netflix, we have several organizations that serve specific purposes. We have our primary OSS organization “Netflix”, our “Spinnaker” organization that is dedicated to our OSS continuous delivery platform, and a skunkworks organization, “Netflix-Skunkworks”, for projects that are in rough development that may or may not become fully-fledged OSS projects, to name a few.

Challenges we face:

One of the biggest challenges with using GitHub organizations is user management. GitHub organizations are individual entities that must be separately administered. As such, the complexity of user management increases with the number of organizations. To reduce complexity, we enforce a consistent permissions model across all of our organizations. This allows us to develop tools to simplify and streamline our GitHub organization administration.

How we apply security to our GitHub organizations:

The permissions model that we follow is one that applies the principle of least privilege, but is still open enough so that developers can obtain the access they need and move fast. The general structure we utilize is to have all employees placed under an employee’s team that has “push” (write) access to all repositories. We similarly have teams for “bot” accounts to provide for automation. Lastly, we have very few users with the “owner” role, as owners are full administrators that can make changes to the organization itself.

While we permit our developers to have write access to all of our repositories, we do not directly permit them to create, delete, or change repository visibility. Additionally, all developers are required to have multi-factor authentication enabled. All of our developers on GitHub have their IDs linked in our internal employee tracking system, and GitHub membership to our organizations is removed when employees leave the company automatically (we have scripts to automate this).

We also enable third-party application restrictions on our organizations to only allow specific third party GitHub applications access to our repositories.

Why is tooling required?

We want to have self-service tooling that provides an equivalent amount of usability as providing users with administrative access, but without the risk of making all users administrators.

Our tooling provides a consistent permissions model across all of our GitHub organizations. It also empowers our users to perform privileged operations on GitHub in a consistent and supported manner, while limiting their individual GitHub account permissions.

Because we limited individual GitHub account permissions, this can be problematic for developers when creating repositories, since they also want to update the description, homepage, and even set default branches. Many of our developers also utilize Travis CI for automated builds. Travis CI enablement requires that users be administrators of their repositories, which we do not permit. Our developers also work with teams outside of Netflix to collaborate with on projects. Our developers do not have permissions to invite users to our organizations or to add outside collaborators to repositories. This is where HubCommander comes in.

The HubCommander Bot

HubCommander is a Slack bot for GitHub organizational management. It provides a ChatOps means for administering GitHub organizations. HubCommander operates by utilizing a privileged account on GitHub to perform administrative capabilities on behalf of our users. Our developers issue commands to the bot to perform their desired actions. This has a number of advantages:
  1. Self-Service: By providing a self-service mechanism, we have significantly reduced our administrative burden for managing our GitHub repositories. The reduction in administrative overhead has significantly simplified our open source efforts.
  2. Consistent and Supported: The bot performs all of the tasks that are required for operating on GitHub. For example, when creating repositories, the bot will automatically provide the correct teams access to the new repository.
  3. Least Privilege for Users: Because the bot can perform the tasks that users need to perform, we can reduce the GitHub API permissions on our users.
  4. Developer Familiarity: ChatOps is very popular at Netflix, so utilizing a bot for this purpose is natural for our developers.
  5. Easy to Use: The bot is easy to use by having an easily discoverable command structure.
  6. Secure: The bot also features integration with Duo for additional authentication.

HubCommander Features:

Out of the box, HubCommander has the following features:
  • Repository creation
  • Repository description and website modification
  • Granting outside collaborators specific permissions to repositories
  • Repository default branch modification
  • Travis CI enablement
  • Duo support to provide authentication to privileged commands
  • Docker image support
HubCommander is also extendable and configurable. You can develop authentication and command based plugins. At Netflix, we have developed a command plugin which allows our developers to invite themselves to any one of our organizations. When they perform this process, their GitHub ID is automatically linked in our internal employee tracking system. With this linkage, we can automatically remove their GitHub organization membership when they leave the company.
Duo is also supported to add additional safeguards for privileged commands. This has the added benefit of protecting against accidental command issuance, as well as the event of Slack credentials getting compromised. With the Duo plugin, issuing a command will also trigger a "Duo push" to the employee’s device. The command only continues to execute if the request is approved. If your company doesn’t use Duo, you can develop your own authentication plugin to integrate with any internal or external authentication system to safeguard commands.
Using the Bot:
Using the bot is as easy as typing !help in the Slack channel. This will provide a list of commands that HubCommander supports:
To learn how to issue a specific command, simply issue that command without any arguments. HubCommander will output the syntax for the command. For example, to create a new repository, you would issue the !CreateRepo command:
If you are safeguarding commands with Duo (or your own authentication plugin), an example of that flow would look like this:
Contributions:
These features are only a starting point, and we plan on adding more soon. If you’d like to extend these features, we’d love contributions to our repository on GitHub.


Introducing Netflix Stethoscope

$
0
0

Netflix is pleased to announce the open source release of Stethoscope, our first project following a User Focused Security approach.

The notion of “User Focused Security” acknowledges that attacks
against corporate users (e.g., phishing, malware) are the primary
mechanism leading to security incidents and data breaches, and it’s one of the core principles driving our approach to corporate
information security. It’s also reflective of our philosophy that tools are only effective when they consider the true context of people’s work.

Stethoscope is a web application that collects information for a given user’s devices and gives them clear and specific recommendations for securing their systems.

If we provide employees with focused, actionable information and low-friction tools, we believe they can get their devices into a more secure state without heavy-handed policy enforcement.


Software that treats people like people, not like cogs in the machine

We believe that Netflix employees fundamentally want to do the right thing, and, as a company, we give people the freedom to do their work as they see fit. As we say in the Netflix Culture Deck, responsible people thrive on freedom, and are worthy of freedom. This isn’t just a nice thing to say–we believe people are most productive and effective when they they aren’t hemmed in by excessive rules and process.

That freedom must be respected by the systems, tools, and procedures we design, as well.

By providing personalized, actionable information–and not relying on automatic enforcement–Stethoscope respects people’s time, attention, and autonomy, while improving our company’s security outcomes.

If you have similar values in your organization, we encourage you to give Stethoscope a try.

Education, not automatic enforcement

It’s important to us that people understand what simple steps they can take to improve the security state of their devices, because personal devices–which we don’t control–may very well be the first target of attack for phishing, malware, and other exploits. If they fall for a phishing attack on their personal laptop, that may be the first step in an attack on our systems here at Netflix.

We also want people to be comfortable making these changes themselves, on their own time, without having to go to the help desk.

To make this self service, and so people can understand the reasoning behind our suggestions, we show additional information about each suggestion, as well as a link to detailed instructions.

Security practices

We currently track the following device configurations, which we call “practices”:

  • Disk encryption
  • Firewall
  • Automatic updates
  • Up-to-date OS/software
  • Screen lock
  • Not jailbroken/rooted
  • Security software stack (e.g., Carbon Black)

Each practice is given a rating that determines how important it is. The more important practices will sort to the top, with critical practices highlighted in red and collected in a top banner.

Implementation and data sources

Stethoscope is powered by a Python backend and a React front end. The web application doesn’t have its own data store, but directly queries various data sources for device information, then merges that data for display.


The various data sources are implemented as plugins, so it should be relatively straightforward to add new inputs. We currently support LANDESK (for Windows), JAMF (for Macs), and Google MDM (for mobile devices).

Notifications

In addition to device status, Stethoscope provides an interface for viewing and responding to notifications.

For instance, if you have a system that tracks suspicious application accesses, you could choose to present a notification like this:


We recommend that you only use these alerts when there is an action for somebody to take–alerts without corresponding actions are often confusing and counterproductive.

Mobile friendly

The Stethoscope user interface is responsive, so it’s easy to use on mobile devices. This is especially important for notifications, which should be easy for people to address even if they aren’t at their desk.

What’s next?

We’re excited to work with other organizations to extend the data sources that can feed into Stethoscope. Osquery is next on our list, and there are many more possible integrations.

Getting started

Stethoscope is available now on GitHub. If you’d like to get a feel for it, you can run the front end with sample data with a single command. We also have a Docker Compose configuration for running the full application.

Join us!

We hope that other organizations find Stethoscope to be a useful tool, and we welcome contributions, especially new plugins for device data.

Our team, Information Security, is also hiring a Senior UI Engineer at our Los Gatos office. If you’d like to help us work on Stethoscope and related tools, please apply!

Presentations

We’d like to thank ShmooCon for giving us the chance to present this work earlier this year. The slides and video are now both publicly available.

by Jesse Kriss and Andrew White

Viewing all 491 articles
Browse latest View live