We’re pleased to announce that we’ve launched a new website at research.netflix.com that provides an overview of the research that we do here at Netflix. We have many amazing researchers working on a variety of hard problems and are happy to share some of our work with the world.
Netflix embraces innovation and has been investing in research to power that innovation for many years. This started with an early focus in areas like recommendations and experimentation but has now expanded to several other research areas and application domains in our business including studio production, marketing, and content delivery. To maximize the impact of our research, we do not centralize research into a separate organization. Instead, we have many teams that pursue research in collaboration with business teams, engineering teams, and other researchers. While this has worked well internally, we have found that it can be difficult to navigate for people outside Netflix who may want to understand our work, connect with our people, or find job opportunities. Thus, we’ve created this website to provide a broad overview of our research. We hope that it provides more insight into some of the areas we work in, the research that we’ve done, and the challenges we face in continuing to make Netflix better.
The site also is a resource for the various publications, blog posts, and talks that we’ve done across these research and business areas. Because our research is focused on improving our product and business, the publications represent a small fraction of the volume of research we conduct at Netflix on an ongoing basis. You can also see from our publications that we’re pretty focused on the applied side of the research spectrum, though we do also pursue fundamental research that we think has the potential for high impact, such as improving our understanding of causality in our data and systems. We also seek to keep engaged in the research community by participating in conferences and organizing research-oriented events.
Going forward we expect our research efforts at Netflix to continue to grow as we keep finding new and better ways to entertain the world. We’ll push forward by discovering new and better ways to personalize more dimensions of our product, using natural language processing and computer vision to build a deeper understanding of content in all phases of its production cycle, and pushing for even better quality in our streaming experience. Expect to see new articles being published, new events announced, and new areas being added on the site as we continue this adventure.
If you’re a die-hard Netflix fan, you may have already stumbled onto the dark and brooding story of a timeless struggle between man and nature, water and fountain, ball and tether known much more plainly as Example Short. In the good old days of 2010, Example Short served us well to evaluate our streaming profiles with maximum resolutions of 1920x1080, frame rates of 30 frames per second (fps) and colorimetry within the BT. 709 gamut.
Of course streaming technology has evolved a great deal in the past eight years. Our technical and artistic requirements now include higher quality source formats with frame rates up to 60 fps, high dynamic range and wider color gamuts up to P3-D65, audio mastered in Dolby Atmos and content cinematically comparable to your regularly unscheduled television programming.
Furthermore, we’ve been able to freely share Example Short and its successors with partners outside of Netflix, to provide a common reference for prototyping bleeding-edge technologies within entertainment, technology and academic circles without compromising the security of our original and licensed programming.
If you’re only familiar with Example Short, allow us to get you up to speed.
Our first test title contains a collection of miscellaneous live action events in 1920x1080 resolution with BT. 709 colorimetry and an LtRt Stereo mix. It was shot natively at four frame rates: 23.976, 24, 25 and 29.97 fps.
As the demand for more pixels increased, so did appropriate test content. El Fuente was shot in 4K at both 48 and 59.94 fps to meet increasing resolution and frame rate requirements.
Chimera is technically comparable to El Fuente, but its scenes are more representative of existing titles. The dinner scene pictured here attempts to recreate a codec-challenging sequence from House of Cards.
Following the industry shift from “more pixels” to “better pixels,” we produced Meridian, our first test title to tell a story. Meridian was mastered in Dolby Vision high dynamic range (HDR) with a P3-D65 color space and PQ (perceptual quantizer) transfer function. It also contained a Dolby Atmos mix, multiple language tracks and subtitles. You can read more about Meridian on Variety and download the entire SDR Interoperable Master Package (IMP) for yourself.
We felt a need to include animated content in our test title library, so we partnered with the Open Movie Project and Fotokem’s Keep Me Posted to re-grade Cosmos Laundromat, an award-winning short film in Dolby Vision HDR.
While our latest test title is technically comparable to Meridian, we’ve chosen to archive its assets and share them to the open source community along with the final deliverables. The production process is described as follows.
Introducing: Sparks, and the Making of.
The idea sparked when we observed construction workers completing one of two new buildings on the Netflix campus. We believed the dark shadows of steel beams juxtaposed perpendicularly to the horizon and the setting sun, contrasted against the glowing light from a welder’s arc would push the dynamic range of any camera to its limits. For our shoot, we acquired a Sony PMW-F55 and the AXS-R5 RAW recorder to shoot 16-bit RAW SQ and maintain the highest dynamic range in capture.
After joining forces with the construction crew, and locating a sharp, talented welder actor, Sparks, a slice-of-life title following the day of said welder was born.
From a technical standpoint, the final deliverable for Sparks is on par with the technical specifications of Meridian, captured at a resolution of 4096x2160, frame rate of 59.94 fps and mastered in Dolby Vision HDR at 4,000 cd/m². To crank things up a notch, we’re delving more into the technical specifics of the workflow, mastering in the open source Academy Color Encoding System (ACES) format, and sharing several production assets.
We captured just over an hour of footage and cut it down to about 3 and a half minutes in Adobe Premiere Pro, editing the Sony RAW SQ format directly, but the real fun began with our high dynamic range color grading session.
Though we began with a first pass color grade on a Sony BVM-X300, capable of reproducing 1000 cd/m², we knew it was critical to finesse our grade on a much more capable display. To accomplish this, we teamed up with Dolby Laboratories in Sunnyvale, CA to create our master color grade using the Pulsar: Dolby’s well-characterized P3-D65 PQ display capable of reproducing luminance levels up to 4000 cd/m². Though at the time atypical for a Dolby Vision workflow, we chose to master our content in ACES so that we could later create derivative output formats for infinitely many displays. With the exception of our first pass color grade, our post-production workflow is outlined as follows:
We video engineers love our acronyms! Some new ones in this workflow diagram include: Edit Decision List (EDL), Input Device Transform (IDT), Reference Rendering Transform (RRT) and Output Device Transform (ODT). The latter three are components of ACES.
Starting with our RAW footage (red) we’ve applied various transforms and operations (blue) to create intermediate formats (yellow) and ultimately, deliverables (green). The specific software and utilities we’ve used in practice are labeled in gray.
Our aim was to create enough intermediates so that a creative could start working with their preferred tool at any stage in the pipeline. This is an open invitation for those who who are eager to download and experiment with the source and intermediate materials.
For example, you could begin with the graded ACES master. Following the steps in the dashed grey box, you could apply a different RRT and ODT to create a master using a specific colorimetry and transfer function. While we graded our ACES footage monitoring at 4000 cd/m² and rendered a Dolby Vision master (P3-D65 PQ), we welcome you to create a different output format or backtrack to the non-graded frame sequence and regrade the footage entirely.
For us, creating the Dolby Vision master also required the use of Dolby’s mezzinator tool to create a JPEG-2000 sequence in an MXF container, which was packaged into an IMP along with our original stereo audio mix. We used this Dolby Vision master as a source format to our encoding pipeline, from which we derive Dolby Vision, HDR10 and SDR bitstreams.
We’ve selected key assets in the production process to share with the open source community. This includes the original Sony RAW files, ACES Non-Graded Archival Master (NAM), ACES Graded Archival Master (GAM), Dolby Vision Video Display Master (VDM), and the final IMP, which can be downloaded from the Open Source Assets section. These assets correspond to the workflow diagram as follows:
From an encoding perspective, Sparks is highly representative of some of the most difficult titles to encode from our catalog. The high spatial frequency and fast motion content in Sparks gives it a complexity that is on par with some of our grainiest titles shot on film, such as Breaking Bad, The Meyerowitz Stories and Lawrence of Arabia. For example, a 1920x1080 H264 AVCMain encode of Sparks required a bitrate of 12568 kbps to achieve a VMAF score of 91.47, where a spatially simplistic animation like BoJack Horseman required only 1,673 kbps to achieve a comparable quality (VMAF=91.10) at the same resolution. For more context on these bitrates, see our article on Video Multimethod Assessment Fusion (VMAF).
Open Source Assets
You can browse the directory structure of our open source assets on aws, and even download the assets through your web browser. We’ve included sample encodes, IMPs and many production assets not only from Sparks but also from Meridian and Cosmos Laundromat. For downloading large files and long frame sequences, you may wish to use command line tools such as aws cli. An asset manifest and detailed instructions can be found in our readme.
Coming Soon: Nocturne
Though Sparks was released in 2017, we have certainly not sat idly watching our test content transcode! (You could say that it’s like watching 18% neutral gray paint dry.) We’ve been actively producing Nocturne, a culmination of the technical and visual features that have been added to our service since 2010. Stay tuned for Part 2.
This article was updated on 11 May 2018 at 15:55. In the workflow diagrams, “OCES” is now replaced with “Dolby Vision Master.” Additional acronyms are also now expanded.
Netflixでは、2015年9月の日本における配信サービス開始時から日本語字幕を提供しています。 今回のブログでは、日本語字幕提供に至るまでの技術的な取り組みについて説明します。 字幕ソースファイルの仕様、字幕ソースファイルからNetflix配信用字幕への変換モデル、Netflixにおける日本語字幕の納品モデルなどを取り上げます。さらに、W3C字幕規格Timed Text Markup Language 2 (TTML2)導入に向けた対応についても触れます。
ルビは特定の言葉を説明するためのものです。 たとえば、なじみのない言葉や外来語、スラングの意味を伝えたり、珍しい漢字またはあまり知られていない漢字にふりがなを付けるために使用します。 また、視聴者がコンテンツをより深く理解し楽しめるように、訳文の文化的背景を説明する場合もあります。 ルビ表示は通常、字幕文字よりも小さなフォントサイズを使い、1行のみの字幕、あるいは2行字幕の1行目には、文字の上にルビを振ります。 2行字幕の2行目にルビが存在する場合、文字の下にルビを振ります。ルビは2行字幕の行間には決して配置しません。どちらの行の文字を説明しているのか分かりづらくなるためです。図1に示すルビの例は、”All he ever amounted to was chitlins.”というセリフの字幕に振られたものです。
日本語のタイポグラフィでは、縦書き文字の中に横書きの短い数字やアルファベット文字が含まれることがよくあります。 これを縦中横と呼びます。 縦に並べるのではなく、半角文字を横並びに配置することで読みやすくなり、字幕1行の中により多くの文字を入れることができます。 図5に示す例は、”It’s as if we are still 23 years old”というセリフの字幕です。 この例では、半角数字”23"が縦中横になっています。
Netflixにおける日本語字幕の導入 was originally published in Netflix TechBlog on Medium, where people are continuing the conversation by highlighting and responding to this story.
We’re pleased to announce the release of our O’Reilly report, Continuous Delivery with Spinnaker. The report is available to download for free on the Spinnaker website. ( Pdf | Epub | Mobi )
About The Report
At Netflix, we’ve built and use Spinnaker as a platform for continuous integration and delivery. It’s used to deploy over 95% of Netflix infrastructure in AWS, comprised of hundreds of microservices and thousands of deployments every day.
We first built Spinnaker to commoditize delivery for internal teams so they can manage their deployments. Our active open source community helped validate Spinnaker’s cloud-first, application-centric view of delivery by contributing tools, stages and cloud provider integrations.
We were motivated to write this report as a high-level introduction to help engineers better understand how Netflix delivers production changes and the way Spinnaker features help simplify continuous delivery to the cloud. The report covers converting a delivery process into pipelines that can safely deploy to Kubernetes and Amazon EC2, adopting and extending Spinnaker, and ways to leverage advanced features like automated canary analysis and declarative delivery. We hope you like it.
Physical Copies
If you would like a physical copy of the report, members of the Spinnaker team will have them on hand at the following upcoming conferences:
Full Cycle Developers at Netflix — Operate What You Build
The year was 2012 and operating a critical service at Netflix was laborious. Deployments felt like walking through wet sand. Canarying was devolving into verifying endurance (“nothing broke after one week of canarying, let’s push it”) rather than correct functionality. Researching issues felt like bouncing a rubber ball between teams, hard to catch the root cause and harder yet to stop from bouncing between one another. All of these were signs that changes were needed.
Fast forward to 2018. Netflix has grown to 125M global members enjoying 140M+ hours of viewing per day. We’ve invested significantly in improving the development and operations story for our engineering teams. Along the way we’ve experimented with many approaches to building and operating our services. We’d like to share one approach, including its pros and cons, that is relatively common within Netflix. We hope that sharing our experiences inspires others to debate the alternatives and learn from our journey.
One Team’s Journey
EdgeEngineering is responsible for the first layer of AWS services that must be up for Netflix streaming to work. In the past, Edge Engineering had ops-focused teams and SRE specialists who owned the deploy+operate+support parts of the software life cycle. Releasing a new feature meant devs coordinating with the ops team on things like metrics, alerts, and capacity considerations, and then handing off code for the ops team to deploy and operate. To be effective at running the code and supporting partners, the ops teams needed ongoing training on new features and bug fixes. The primary upside of having a separate ops team was less developer interrupts when things were going well.
When things didn’t go well, the costs added up. Communication and knowledge transfers between devs and ops/SREs were lossy, requiring additional round trips to debug problems or answer partner questions. Deployment problems had a higher time-to-detect and time-to-resolve due to the ops teams having less direct knowledge of the changes being deployed. The gap between code complete and deployed was much longer than today, with releases happening on the order of weeks rather than days. Feedback went from ops, who directly experienced pains such as lack of alerting/monitoring or performance issues and increased latencies, to devs, who were hearing about those problems second-hand.
To improve on this, Edge Engineering experimented with a hybrid model where devs could push code themselves when needed, and also were responsible for off-hours production issues and support requests. This improved the feedback and learning cycles for developers. But, having only partial responsibility left gaps. For example, even though devs could do their own deployments and debug pipeline breakages, they would often defer to the ops release specialist. For the ops-focused people, they were motivated to do the day to day work but found it hard to prioritize automation so that others didn’t need to rely on them.
In search of a better way, we took a step back and decided to start from first principles. What were we trying to accomplish and why weren’t we being successful?
The Software Life Cycle
The purpose of the software life cycle is to optimize “time to value”; to effectively convert ideas into working products and services for customers. Developing and running a software service involves a full set of responsibilities:
SDLC components
We had been segmenting these responsibilities. At an extreme, this means each functional area is owned by a different person/role:
SDLC specialists
These specialized roles create efficiencies within each segment while potentially creating inefficiencies across the entire life cycle. Specialists develop expertise in a focused area and optimize what’s needed for that area. They get more effective at solving their piece of the puzzle. But software requires the entire life cycle to deliver value to customers. Having teams of specialists who each own a slice of the life cycle can create silos that slow down end-to-end progress. Grouping differing specialists together into one team can reduce silos, but having different people do each role adds communication overhead, introduces bottlenecks, and inhibits the effectiveness of feedback loops.
Operating What You Build
To rethink our approach, we drew inspiration from the principles of the devops movement. We could optimize for learning and feedback by breaking down silos and encouraging shared ownership of the full software life cycle:
SDLC with devops principles
“Operate what you build” puts the devops principles in action by having the team that develops a system also be responsible for operating and supporting that system. Distributing this responsibility to each development team, rather than externalizing it, creates direct feedback loops and aligns incentives. Teams that feel operational pain are empowered to remediate the pain by changing their system design or code; they are responsible and accountable for both functions. Each development team owns deployment issues, performance bugs, capacity planning, alerting gaps, partner support, and so on.
Scaling Through Developer Tools
Ownership of the full development life cycle adds significantly to what software developers are expected to do. Tooling that simplifies and automates common development needs helps to balance this out. For example, if software developers are expected to manage rollbacks of their services, rich tooling is needed that can both detect and alert them of the problems as well as to aid in the rollback.
Netflix created centralized teams (e.g., Cloud Platform, Performance & Reliability Engineering, Engineering Tools) with the mission of developing common tooling and infrastructure to solve problems that every development team has. Those centralized teams act as force multipliers by turning their specialized knowledge into reusable building blocks. For example:
Specialists create reusable tools
Empowered with these tools in hand, development teams can focus on solving problems within their specific product domain. As additional tooling needs arise, centralized teams assess whether the needs are common across multiple dev teams. When they are, collaborations ensue. Sometimes these local needs are too specific to warrant centralized investment. In that case the development team decides if their need is important enough for them to solve on their own.
Balancing local versus central investment in similar problems is one of the toughest aspects of our approach. In our experience the benefits of finding novel solutions to developer needs are worth the risk of multiple groups creating parallel solutions that will need to converge down the road. Communication and alignment are the keys to success. By starting well-aligned on the needs and how common they are likely to be, we can better match the investment to the benefits to dev teams across Netflix.
Full Cycle Developers
By combining all of these ideas together, we arrived at a model where a development team, equipped with amazing developer productivity tools, is responsible for the full software life cycle: design, development, test, deploy, operate, and support.
The empowered full cycle developer
Full cycle developers are expected to be knowledgeable and effective in all areas of the software life cycle. For many new-to-Netflix developers, this means ramping up on areas they haven’t focused on before. We run dev bootcamps and other forms of ongoing training to impart this knowledge and build up these skills. Knowledge is necessary but not sufficient; easy-to-use tools for deployment pipelines (e.g., Spinnaker) and monitoring (e.g., Atlas) are also needed for effective full cycle ownership.
Full cycle developers apply engineering discipline to all areas of the life cycle. They evaluate problems from a developer perspective and ask questions like “how can I automate what is needed to operate this system?” and “what self-service tool will enable my partners to answer their questions without needing me to be involved?” This helps our teams scale by favoring systems-focused rather than humans-focused thinking and automation over manual approaches.
Moving to a full cycle developer model requires a mindset shift. Some developers view design+development, and sometimes testing, as the primary way that they create value. This leads to the anti-pattern of viewing operations as a distraction, favoring short term fixes to operational and support issues so that they can get back to their “real job”. But the “real job” of full cycle developers is to use their software development expertise to solve problems across the full life cycle. A full cycle developer thinks and acts like an SWE, SDET, and SRE. At times they create software that solves business problems, at other times they write test cases for that, and still other times they automate operational aspects of that system.
For this model to succeed, teams must be committed to the value it brings and be cognizant of the costs. Teams need to be staffed appropriately with enough headroom to manage builds and deployments, handle production issues, and respond to partner support requests. Time needs to be devoted to training. Tools need to be leveraged and invested in. Partnerships need to be fostered with centralized teams to create reusable components and solutions. All areas of the life cycle need to be considered during planning and retrospectives. Investments like automating alert responses and building self-service partner support tools need to be prioritized alongside business projects. With appropriate staffing, prioritization, and partnerships, teams can be successful at operating what they build. Without these, teams risk overload and burnout.
To apply this model outside of Netflix, adaptations are necessary. The common problems across your dev teams are likely similar — from the need for continuous delivery pipelines, monitoring/observability, and so on. But many companies won’t have the staffing to invest in centralized teams like at Netflix, nor will they need the complexity that Netflix’s scale requires. Netflix’s tools are often open source, and it may be compelling to try them as a first pass. However, other open source and SaaS solutions to these problems can meet most companies needs. Start with analysis of the potential value and count the costs, followed by the mindset-shift. Evaluate what you need and be mindful of bringing in the least complexity necessary.
Trade-offs
The tech industry has a wide range of ways to solve development and operations needs (see devops topologies for an extensive list). The full cycle model described here is common at Netflix, but has its downsides. Knowing the trade-offs before choosing a model can increase the chance of success.
With the full cycle model, priority is given to a larger area of ownership and effectiveness in those broader domains through tools. Breadth requires both interest and aptitude in a diverse range of technologies. Some developers prefer focusing on becoming world class experts in a narrow field and our industry needs those types of specialists for some areas. For those experts, the need to be broad, with reasonable depth in each area, may be uncomfortable and sometimes unfulfilling. Some at Netflix prefer to be in an area that needs deep expertise without requiring ongoing breadth and we support them in finding those roles; others enjoy and welcome the broader responsibilities.
In our experience with building and operating cloud-based systems, we’ve seen effectiveness with developers who value the breadth that owning the full cycle requires. But that breadth increases each developer’s cognitive load and means a team will balance more priorities every week than if they just focused on one area. We mitigate this by having an on-call rotation where developers take turns handling the deployment + operations + support responsibilities. When done well, that creates space for the others to do the focused, flow-state type work. When not done well, teams devolve into everyone jumping in on high-interrupt work like production issues, which can lead to burnout.
Tooling and automation help to scale expertise, but no tool will solve every problem in the developer productivity and operations space. Netflix has a “paved road” set of tools and practices that are formally supported by centralized teams. We don’t mandate adoption of those paved roads but encourage adoption by ensuring that development and operations using those technologies is a far better experience than not using them. The downside of our approach is that the ideal of “every team using every feature in every tool for their most important needs” is near impossible to achieve. Realizing the returns on investment for our centralized teams’ solutions requires effort, alignment, and ongoing adaptations.
Conclusion
The path from 2012 to today has been full of experiments, learning, and adaptations. Edge Engineering, whose earlier experiences motivated finding a better model, is actively applying the full cycle developer model today. Deployments are routine and frequent, canaries take hours instead of days, and developers can quickly research issues and make changes rather than bouncing the responsibilities across teams. Other groups are seeing similar benefits. However, we’re cognizant that we got here by applying and learning from alternate approaches. We expect tomorrow’s needs to motivate further evolution.
Interested in seeing this model in action? Want to be a part of exploring how we evolve our approaches for the future? Consider joining us.
We are excited to announce the open sourcing of Zuul 2, Netflix’s cloud gateway. We use Zuul 2 at Netflix as the front door for all requests coming into Netflix’s cloud infrastructure. Zuul 2 significantly improves the architecture and features that allow our gateway to handle, route, and protect Netflix’s cloud systems, and helps provide our 125 million members the best experience possible. The Cloud Gateway team at Netflix runs and operates more than 80 clusters of Zuul 2, sending traffic to about 100 (and growing) backend service clusters which amounts to more than 1 million requests per second. Nearly all of this traffic is from customer devices and browsers that enable the discovery and playback experience you are likely familiar with.
This post will overview Zuul 2, provide details on some of the interesting features we are releasing today, and discuss some of the other projects that we’re building with Zuul 2.
How Zuul 2 Works
For context, here’s a high-level diagram of Zuul 2’s architecture:
The Netty handlers on the front and back of the filters are mainly responsible for handling the network protocol, web server, connection management and proxying work. With those inner workings abstracted away, the filters do all of the heavy lifting. The inbound filters run before proxying the request and can be used for authentication, routing, or decorating the request. The endpoint filters can either be used to return a static response or proxy the request to the backend service (or origin as we call it). The outbound filters run after a response has been returned and can be used for things like gzipping, metrics, or adding/removing custom headers.
Zuul’s functionality depends almost entirely on the logic that you add in each filter. That means you can deploy it in multiple contexts and have it solve different problems based on the configurations and filters it is running.
We use Zuul at the entrypoint of all external traffic into Netflix’s cloud services and we’ve started using it for routing internal traffic, as well. We deploy the same core but with a substantially reduced amount of functionality (i.e. fewer filters). This allows us to leverage load balancing, self service routing, and resiliency features for internal traffic.
Open Source
The Zuul code that’s running today is the most stable and resilient version of Zuul yet. The various phases of evolving and refactoring the codebase have paid dividends and we couldn’t be happier to share it with you.
Today we are releasing many core features. Here are the ones we’re most excited about:
Server Protocols
HTTP/2 — full server support for inbound HTTP/2 connections
Mutual TLS — allow for running Zuul in more secure scenarios
Resiliency Features
Adaptive Retries — the core retry logic that we use at Netflix to increase our resiliency and availability
Origin Concurrency Protection — configurable concurrency limits to protect your origins from getting overloaded and protect other origins behind Zuul from each other
Operational Features
Request Passport — track all the lifecycle events for each request, which is invaluable for debugging async requests
Status Categories — an enumeration of possible success and failure states for requests that are more granular than HTTP status codes
Request Attempts — track proxy attempts and status of each, particularly useful for debugging retries and routing
We are also working on some features that will be coming soon, including:
Websocket/SSE — support for side-channel push notifications
Throttling and rate-limiting — protection from malicious client connections and requests, helping defend against volumetric attacks
Brownout filters — for disabling certain CPU-intensive features when Zuul is overloaded
Configurable routing — file-based routing configuration, instead of having to create routing filters in Zuul
We would love to hear from you and see all the new and interesting applications of Zuul. For instructions on getting started, please visit our wiki page.
Leveraging Zuul 2 at Netflix
Internally, there are several major features that we’ve been working on but have not open sourced yet. Each one deserves its own blog post, but let’s go over them briefly.
Self Service Routing
The most widely-used feature by our partners is self service routing. We provide an application and API for users to create routing rules based on any criteria in the request URL, path, query params, or headers. We then publish these routing rules to all the Zuul instances.
The main use case is for routing traffic to a specific test or staging cluster. However, there are many use cases for real production traffic. For example:
Services needing to shard their traffic create routing rules that map certain paths or prefixes to separate origins
Developers onboard new services by creating a route that maps a new hostname to their new origin
Developers run load tests by routing a percentage of existing traffic to a small cluster and ensuring applications will degrade gracefully under load
Teams refactoring applications migrate to a new origin slowly by creating rules mapping traffic gradually, one path at a time
Teams test changes (canary testing) by sending a small percentage of traffic to an instrumented cluster running the new build
If teams need to test changes requiring multiple consecutive requests on their new build, they run sticky canary tests that route the same users to their new build for brief periods of time
Security teams create rules that reject “bad” requests based on path or header rules across all Zuul clusters
As you can see we use self service routing extensively and are increasing the customizability and scope of routes to allow for even more use cases.
Load Balancing for Resiliency
Another major feature we’ve worked on is making load balancing to origins more intelligent. We are able to route around failures, slowness, GC issues, and various other things that crop up often when running large amounts of nodes. The goal of this work is to increase resiliency, availability, and quality of service for all Netflix services.
We have several cases that we handle:
Cold Instances
When new origin instances start up, we send them a reduced amount of traffic for some time, until they’re warmed up. This was an issue we observed for applications with large codebases and huge metaspace usage. It takes a significant amount of time for these apps to JIT their code and be ready to handle a large amount of traffic.
We also generally bias the traffic to older instances and if we happen to hit a cold instance that throttles, we can always retry on a warm one. This gives us an order of magnitude improvement in availability.
High Error Rates
Errors happen all the time and for varying reasons, whether it’s because of a bug in the code, a bad instance, or an invalid configuration property being set. Fortunately, as a proxy, we can detect errors reliably — either we get a 5xx error or there are connectivity problems to the service.
We track error rates for each origin and if the error rate is high enough, it implies the entire service is in trouble. We throttle retries from devices and disable internal retries to allow the service to recover. Moreover, we also track successive failures per instance and blacklist the bad ones for a period of time.
Overloaded Instances
With the above approaches we send less traffic to servers in a cluster that are throttling or refusing connections, and lessened the impact by retrying those failed requests on other servers.
We’re now rolling out an additional approach where we aim to avoid overloading servers in the first place. This is achieved by allowing origins to signal to Zuul their current utilization, which Zuul then uses as a factor in its load-balancing choices — leading to reduced error rates, retries, and latency.
The origins add a header to all responses stating their utilization as a percentage, along with a target utilization they would like to have across the cluster. Calculating the percentage is completely up to each application and engineers can use whatever metric suits them best. This allows for a general solution as opposed to us trying to come up with a one-size-fits-all approach.
With this functionality in place, we assign a score (combination of instance utilization and other factors like the ones above) to each instance and do a choice-of-two load balancing selection.
Anomaly Detection and Contextual Alerting
As we grew from just a handful of origins to a new world where anyone can quickly spin up a container cluster and put it behind Zuul, we found there was a need to automatically detect and pinpoint origin failures.
With the help of Mantis real time event streaming, we built an anomaly detector that aggregates error rates per service and notifies us in real time when services are in trouble. It takes all of the anomalies in a given time window and creates a timeline of all the origins in trouble. We then create a contextual alert email with the timeline of events and services affected. This allows an operator to quickly correlate these events and orient themselves to debug a specific app or feature, and ultimately find the root cause.
In fact, it was so useful that we expanded it to send notifications to the origin teams themselves. We’ve also added more internal applications, other than Zuul, and can build a much more extensive timeline of events. This has been a huge help during production incidents and helps operators quickly detect and fix problems before they cascade into massive outages.
We hope to open source as many of the above features as we can. Keep watching the tech blog for more depth on them in the future. If you want to help us solve these kinds of problem, please check out our jobs site.
— Arthur Gonigberg ( @agonigberg ), Mikey Cohen (@moldfarm ), Michael Smith (@kerumai ), Gaya Varadarajan ( @gaya3varadhu ), Sudheer Vinukonda ( @apachesudheerv ), Susheel Aroskar (@susheelaroskar )
Open Sourcing Zuul 2 was originally published in Netflix TechBlog on Medium, where people are continuing the conversation by highlighting and responding to this story.
Our mission at Netflix is to deliver joy to our members by providing high-quality content, presented with a delightful experience. We are constantly innovating on our product at a rapid pace in pursuit of this mission. Our innovations span personalized title recommendations, infrastructure, and application features like downloading and customer profiles. Our growing global member base of 125 million members can choose to enjoy our service on over a thousand types of devices. If you also consider the scale and variety of content, maintaining the quality of experience for all our members is an interesting challenge. We tackle that challenge by developing observability tools and infrastructure to measure customers’ experiences and analyze those measurements to derive meaningful insights and higher-level conclusions from raw data. By observability, we mean analysis of logs, traces, and metrics. In this post, we share the following lessons we have learned:
At some point in business growth, we learned that storing raw application logs won’t scale. To address scalability, we switched to streaming logs, filtering them on selected criteria, transforming them in memory, and persisting them as needed.
As applications migrated to having a microservices architecture, we needed a way to gain insight into the complex decisions that microservices were making. Distributed request tracing is a start, but is not sufficient to fully understand application behavior and reason about issues. Augmenting the request trace with application context and intelligent conclusions is also necessary.
Besides analysis of logging and request traces, observability also includes analysis of metrics. By exploring metrics anomaly detection and metrics correlation, we’ve learned how to define actionable alerting beyond just threshold alerting.
Our observability tools need to access various persisted data types. Choosing which kind of database to store a given data type depends on how each particular data type is written and retrieved.
Data presentation requirements vary widely between teams and users. It is critical to understand your users and deliver views tailored to a user’s profile.
Scaling Log Ingestion
We started our tooling efforts with providing visibility into device and server logs, so that our users can go to one tool instead of having to use separate data-specific tools or logging into servers. Providing visibility into logs is valuable because log messages include important contextual information, especially when errors occur.
However, at some point in our business growth, storing device and server logs didn’t scale because the increasing volume of log data caused our storage cost to balloon and query times to increase. Besides reducing our storage retention time period, we addressed scalability by implementing a real-time stream processing platform called Mantis. Instead of saving all logs to persistent storage, Mantis enables our users to stream logs into memory, and keep only those logs that match SQL-like query criteria. Users also have the choice to transform and save matching logs to persistent storage. A query that retrieves a sample of playback start events for the Apple iPad is shown in the following screenshot:
Mantis query results for sample playback start events
Once a user obtains an initial set of samples, they can iteratively refine their queries to narrow down the specific set of samples. For example, perhaps the root cause of an issue is found from only samples in a specific country. In this case, the user can submit another query to retrieve samples from that country.
The key takeaway is that storing all logs in persistent storage won’t scale in terms of cost and acceptable query response time. An architecture that leverages real-time event streams and provides the ability to quickly and iteratively identify the relevant subset of logs is one way to address this problem.
Distributed Request Tracing
As applications migrated to a microservices architecture, we needed insight into the complex decisions that microservices are making, and an approach that would correlate those decisions. Inspired by Google’s Dapper paper on distributed request tracing, we embarked on implementing request tracing as a way to address this need. Since most inter-process communication uses HTTP and gRPC (with the trend for newer services to use gRPC to benefit from its binary protocol), we implemented request interceptors for HTTP and gRPC calls. These interceptors publish trace data to Apache Kafka, and a consuming process writes trace data to persistent storage.
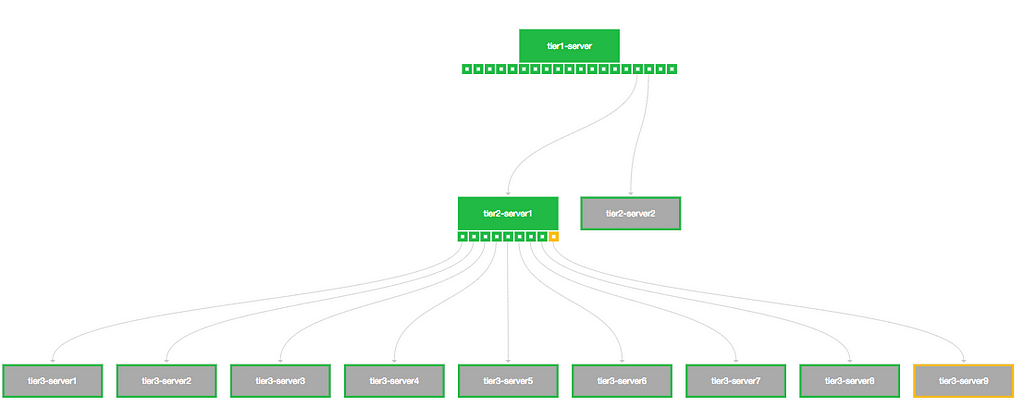
The following screenshot shows a sample request trace in which a single request results in calling a second tier of servers, one of which calls a third-tier of servers:
Sample request trace
The smaller squares beneath a server indicate individual operations. Gray-colored servers don’t have tracing enabled.
A distributed request trace provides only basic utility in terms of showing a call graph and basic latency information. What is unique in our approach is that we allow applications to add additional identifiers to trace data so that multiple traces can be grouped together across services. For example, for playback request traces, all the requests relevant to a given playback session are grouped together by using a playback session identifier. We also implemented additional logic modules called analyzers to answer common troubleshooting questions. Continuing with the above example, questions about a playback session might be why a given session did or did not receive 4K video, or why video was or wasn’t offered with High Dynamic Range.
Our goal is to increase the effectiveness of our tools by providing richer and more relevant context. We have started implementing machine learning analysis on error logs associated with playback sessions. This analysis does some basic clustering to display any common log attributes, such as Netflix application version number, and we display this information along with the request trace. For example, if a given playback session has an error log, and we’ve noticed that other similar devices have had the same error with the same Netflix application version number, we will display that application version number. Users have found this additional contextual information helpful in finding the root cause of a playback error.
In summary, the key learnings from our effort are that tying multiple request traces into a logical concept, a playback session in this case, and providing additional context based on constituent traces enables our users to quickly determine the root cause of a streaming issue that may involve multiple systems. In some cases, we are able to take this a step further by adding logic that determines the root cause and provides an English explanation in the user interface.
Analysis of Metrics
Besides analysis of logging and request traces, observability also involves analysis of metrics. Because having users examine many logs is overwhelming, we extended our offering by publishing log error counts to our metrics monitoring system called Atlas, which enables our users to quickly see macro-level error trends using multiple dimensions, such as device type and customer geographical location. An alerting system also allows users to receive alerts if a given metric exceeds a defined threshold. In addition, when using Mantis, a user can define metrics derived from matching logs and publish them to Atlas.
Next, we have implemented statistical algorithms to detect anomalies in metrics trends, by comparing the current trend with a baseline trend. We are also working on correlating metrics for related microservices. From our work with anomaly detection and metrics correlation, we’ve learned how to define actionable alerting beyond just basic threshold alerting. In a future blog post, we’ll discuss these efforts.
Data Persistence
We store data used by our tools in Cassandra, Elasticsearch, and Hive. We chose a specific database based primarily on how our users want to retrieve a given data type, and the write rate. For observability data that is always retrieved by primary key and a time range, we use Cassandra. When data needs to be queried by one or more fields, we use Elasticsearch since multiple fields within a given record can be easily indexed. Finally, we observed that recent data, such as up to the last week, is accessed more frequently than older data, since most of our users troubleshoot recent issues. To serve the use case where someone wants to access older data, we also persist the same logs in Hive but for a longer time period.
Cassandra, Elasticsearch, and Hive have their own advantages and disadvantages in terms of cost, latency, and queryability. Cassandra provides the best, highest per-record write and read rates, but is restrictive for reads because you must decide what to use for a row key (a unique identifier for a given record) and within each row, what to use for a column key, such as a timestamp. In contrast, Elasticsearch and Hive provide more flexibility with reads because Elasticsearch allows you to index any field within a record, and Hive’s SQL-like query language allows you to match against any field within a record. However, since Elasticsearch is primarily optimized for free text search, its indexing overhead during writes will demand more computing nodes as write rate increases. For example, for one of our observability data sets, we initially stored data in Elasticsearch to be able to easily index more than one field per record, but as the write rate increased, indexing time became long enough that either the data wasn’t available when users queried for it, or it took too long for data to be returned. As a result, we migrated to Cassandra, which had shorter write ingestion time and shorter data retrieval time, but we defined data retrieval for the three unique keys that serve our current data retrieval use cases.
For Hive, since records are stored in files, reads are relatively much slower than Cassandra and Elasticsearch because Hive must scan files. Regarding storage and computing cost, Hive is the cheapest because multiple records can be kept in a single file, and data isn’t replicated. Elasticsearch is most likely the next more expensive option, depending on the write ingestion rate. Elasticsearch can also be configured to have replica shards to enable higher read throughput. Cassandra is most likely the most expensive, since it encourages replicating each record to more than one replica in order to ensure reliability and fault tolerance.
Tailoring User Interfaces for Different User Groups
As usage of our observability tools grows, users have been continually asking for new features. Some of those new feature requests involve displaying data in a view customized for specific user groups, such as device developers, server developers, and Customer Service. On a given page in one of our tools, some users want to see all types of data that the page offers, whereas other users want to see only a subset of the total data set. We addressed this requirement by making the page customizable via persisted user preferences. For example, in a given table of data, users want the ability to choose which columns they want to see. To meet this requirement, for each user, we store a list of visible columns for that table. Another example involves a log type with large payloads. Loading those logs for a customer account increases the page loading time. Since only a subset of users are interested in this log type, we made loading these logs a user preference.
Examining a given log type may require domain expertise that not all users may have. For example, for a given log from a Netflix device, understanding the data in the log requires knowledge of some identifiers, error codes, and some string keys. Our tools try to minimize the specialized knowledge required to effectively diagnose problems by joining identifiers with the data they refer to, and providing descriptions of error codes and string keys.
In short, our learning here is that customized views and helpful context provided by visualizations that surface relevant information are critical in communicating insights effectively to our users.
Conclusion
Our observability tools have empowered many teams within Netflix to better understand the experience we are delivering to our customers and quickly troubleshoot issues across various facets such as devices, titles, geographical location, and client app version. Our tools are now an essential part of the operational and debugging toolkit for our engineers. As Netflix evolves and grows, we want to continue to provide our engineers with the ability to innovate rapidly and bring joy to our customers. In future blog posts, we will dive into technical architecture, and we will share our results from some of our ongoing efforts such as metrics analysis and using machine learning for log analysis.
If any of this work sounds exciting to you, please reach out to us!
— Kevin Lew (@kevinlew15) and Sangeeta Narayanan (@sangeetan)
In the IEEE Signal Processing Magazine issue November 2006 article “Future of Video Coding and Transmission” Prof. Edward Delp started by asking the panelists “Is video coding dead? Some feel that, with the higher coding efficiency of the H.264/MPEG-4 . . . perhaps there is not much more to do. I must admit that I have heard this compression is dead argument at least four times since I started working in image and video coding in 1976.”
People were postulating that video coding was dead more than four decades ago. And yet here we are in 2018, organizing the 33rd edition of Picture Coding Symposium (PCS).
Is image and video coding dead? From the standpoint of application and relevance, video compression is very much alive and kicking and thriving on the internet. The Cisco white paper “The Zettabyte Era: Trends and Analysis (June 2017)” reported that in 2016, IP video traffic accounted for 73% of total IP traffic. This is estimated to go up to 82% by 2021. Sandvine reported in the “Global Internet Phenomena Report, June 2016” that 60% of peak download traffic on fixed access networks in North America was accounted for by four VOD services: Netflix, YouTube, Amazon Video and Hulu. Ericsson’s “Mobility Report November 2017” estimated that for mobile data traffic in 2017, video applications occupied 55% of the traffic. This is expected to increase to 75% by 2023.
As for industry involvement in video coding research, it appears that the area is more active than ever before. The Alliance for Open Media (AOM) was founded in 2015 by leading tech companies to collaborate on an open and royalty-free video codec. The goal of AOM was to develop video coding technology that was efficient, cost-effective, high quality and interoperable, leading to the launch of AV1 this year. In the ITU-T VCEG and ISO/IEC MPEG standardization world, the Joint Video Experts Team (JVET) was formed in October 2017 to develop a new video standard that has capabilities beyond HEVC. The recently-concluded Call for Proposals attracted an impressive number of 32 institutions from industry and academia, with a combined 22 submissions. The new standard, which will be called Versatile Video Coding (VVC), is expected to be finalized by October 2020.
Like many global internet companies, Netflix realizes that advancements in video coding technology are crucial for delivering more engaging video experiences. On one end, many people are constrained by unreliable networks or limited data plans, restricting the video quality that can be delivered with current technology. On the other side of the spectrum, premium video experiences like 4K UHD, 360-degree video and VR, are extremely data-heavy. Video compression gains are necessary to fuel the adoption of these immersive video technologies.
So how will we get to deliver HD quality Stranger Things at 100 kbps for the mobile user in rural Philippines? How will we stream a perfectly crisp 4K-HDR-WCG episode of Chef’s Table without requiring a 25 Mbps broadband connection? Radically new ideas. Collaboration. And forums like the Picture Coding Symposium 2018 where the video coding community can share, learn and introspect.
Influenced by our product roles at Netflix, exposure to the standardization community and industry partnerships, and research collaboration with academic institutions, we share some of our questions and thoughts on the current state of video coding research. These ideas have inspired us as we embarked on organizing the special sessions, keynote speeches and invited talks for PCS 2018.
MPEG-2, VC1, H.263, H.264/AVC, H.265/HEVC, VP9, AV1 — all of these standards were built on the block-based hybrid video coding structure. Attempts to veer away from this traditional model have been unsuccessful. In some cases (say, distributed video coding), it was because the technology was impractical for the prevalent use case. In most other cases, however, it is likely that not enough resources were invested in the new technology to allow for maturity. Unfortunately, new techniques are evaluated against the state-of-the-art codec, for which the coding tools have been refined from decades of investment. It is then easy to drop the new technology as “not at-par.” Are we missing on better, more effective techniques by not allowing new tools to mature? How many redundant bits can we squeeze out if we simply stay on the paved path and iterate on the same set of encoding tools?
The community needs better ways to measure video quality.
In academic publications, standardization activities, and industry codec evaluations, PSNR remains the gold standard for evaluating encoding performance. And yet every person in the field will tell you that PSNR does not accurately reflect human perception. Encoding tools like adaptive quantization and psycho-visual optimization claim to improve visual quality but fare worse in terms of PSNR. So researchers and engineers augment the objective measurements with labor-intensive visual subjective tests. Although this evaluation methodology has worked for decades, it is infeasible for large scale evaluation, especially, if the test set spans diverse content and wide quality ranges. For the video codec community to innovate more quickly, and more accurately, automated video quality measurements that better reflect human perception should be utilized. These new metrics have to be widely agreed upon and adopted, so it is necessary that they open and independently verifiable. Can we confidently move video encoding technology without solving the problem of automated video quality assessment first?
Encouraging new ideas means discussing with new people.
I (Anne) attended my first MPEG meeting three years ago where I presented an input document on Netflix use cases for future video coding. I claimed that for the Netflix application, encoding complexity increase is not a concern if it comes with significant compression improvement. We run compute on the cloud and have no real-time requirements. I was asked by the Chair, “How much complexity increase is acceptable?” I was not prepared for the question, so did some quick math in my mind estimating an upper bound and said “At the worst case 100X.” The room of about a hundred video standardization experts burst out laughing. I looked at the Chair perplexed, and he says, “Don’t worry they are happy that they can try-out new things. People typically say 3X.” We were all immersed in the video codec space and yet my views surprised them and vice versa.
The video coding community today is composed of research groups in academia, institutions active in video standardization, companies implementing video codec technologies and technology and entertainment companies deploying video services. How do we foster more cross-pollination and collaboration across these silos to positively lift all boats?
Building bridges at Picture Coding Symposium 2018
In the spirit of stimulating more perplexed looks that will then hopefully lead to more “aha!” moments, we have organized a series of “Bridging the Gap” sessions for PCS 2018. The talks and panel discussion aim to connect PCS researchers with related fields and communities.
Researchers in computer vision and machine learning are excited to apply these techniques to image compression, as demonstrated by the CVPR Workshop and Challenge on Learned Image Compression. Johannes Ballé will give an introduction on the emerging field of learned image compression and summarize the results of this CVPR Workshop and Challenge.
Video experts from ITU-T VCEG and ISO/IEC MPEG are actively working on the next-generation standard VVC. The Co-Chairs of this activity, Gary J. Sullivan and Prof. Jens-Rainer Ohm, will give a summary of the results, to encourage early feedback and participation from academic researchers and potential industry users of the technology.
To address the disconnect between researchers in academia and standardization and the industry users of video coding technology, we have invited engineering leaders responsible for large-scale video encoding. Michael Coward from Facebook, Mark Kalman from Twitter and Balu Adsumilli from YouTube will participate in a panel discussion, sharing their thoughts and experiences on the challenges of encoding-at-scale for VOD and live video streaming services.
We hope that Picture Coding Symposium 2018 will build bridges, spark stimulating discussions and foster groundbreaking innovation in video and image coding. Join us in San Francisco to help shape the future of video coding!
The End of Video Coding? was originally published in Netflix TechBlog on Medium, where people are continuing the conversation by highlighting and responding to this story.
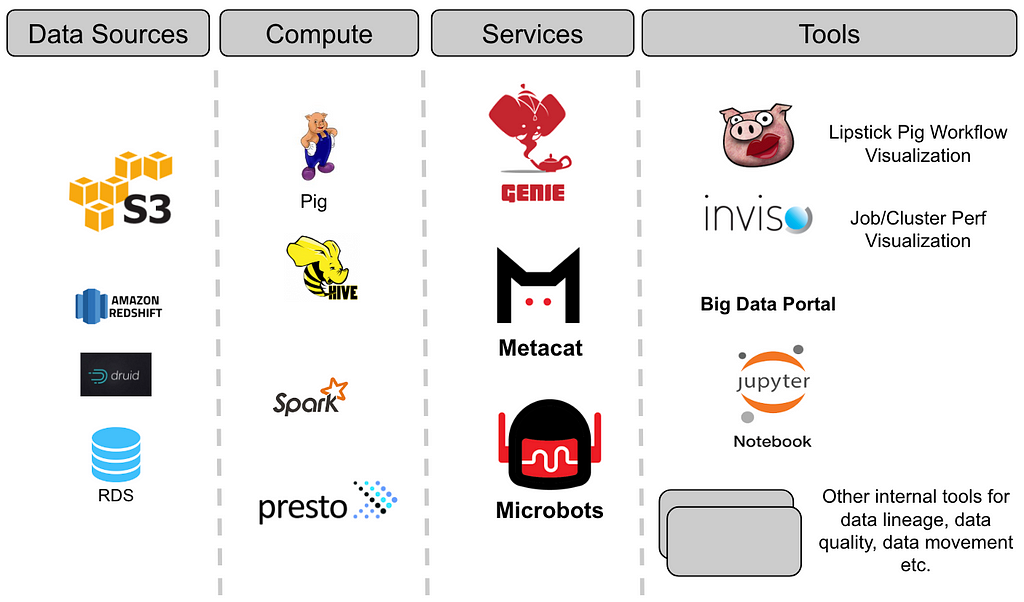
Most large companies have numerous data sources with different data formats and large data volumes. These data stores are accessed and analyzed by many people throughout the enterprise. At Netflix, our data warehouse consists of a large number of data sets stored in Amazon S3 (via Hive), Druid, Elasticsearch, Redshift, Snowflake and MySql. Our platform supports Spark, Presto, Pig, and Hive for consuming, processing and producing data sets. Given the diverse set of data sources, and to make sure our data platform can interoperate across these data sets as one “single” data warehouse, we built Metacat. In this blog, we will discuss our motivations in building Metacat, a metadata service to make data easy to discover, process and manage.
Objectives
The core architecture of the big data platform at Netflix involves three key services. These are the execution service (Genie), the metadata service, and the event service. These ideas are not unique to Netflix, but rather a reflection of the architecture that we felt would be necessary to build a system not only for the present, but for the future scale of our data infrastructure.
Many years back, when we started building the platform, we adopted Pig as our ETL language and Hive as our ad-hoc querying language. Since Pig did not natively have a metadata system, it seemed ideal for us to build one that could interoperate between both.
Thus Metacat was born, a system that acts as a federated metadata access layer for all data stores we support. A centralized service that our various compute engines could use to access the different data sets. In general, Metacat serves three main objectives:
Federated views of metadata systems
Unified API for metadata about datasets
Arbitrary business and user metadata storage of datasets
It is worth noting that other companies that have large and distributed data sets also have similar challenges. Apache Atlas, Twitter’s Data Abstraction Layer and Linkedin’s WhereHows (Data Discovery at Linkedin), to name a few, are built to tackle similar problems, but in the context of the respective architectural choices of the companies.
Metacat
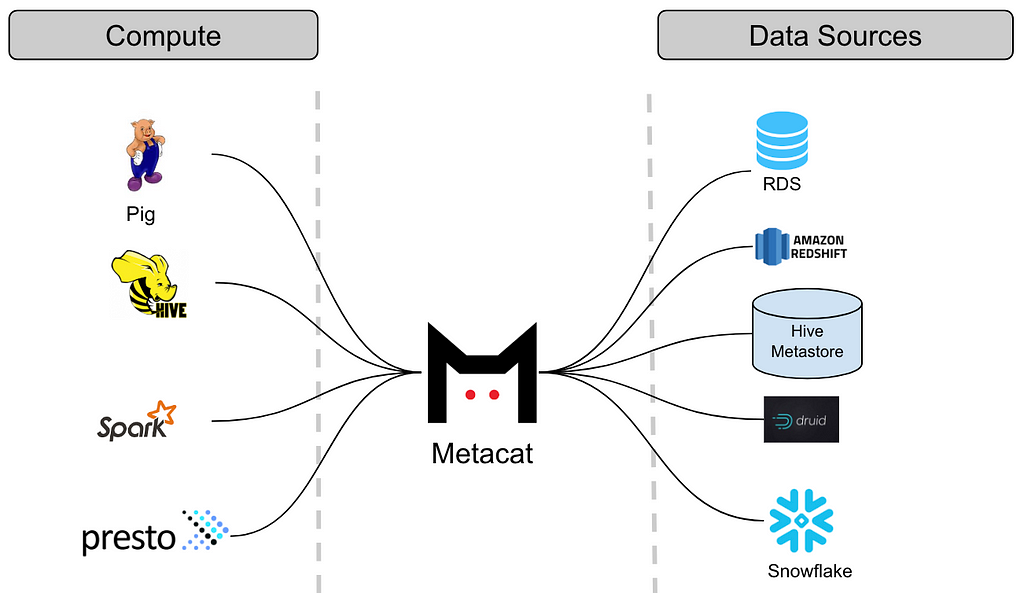
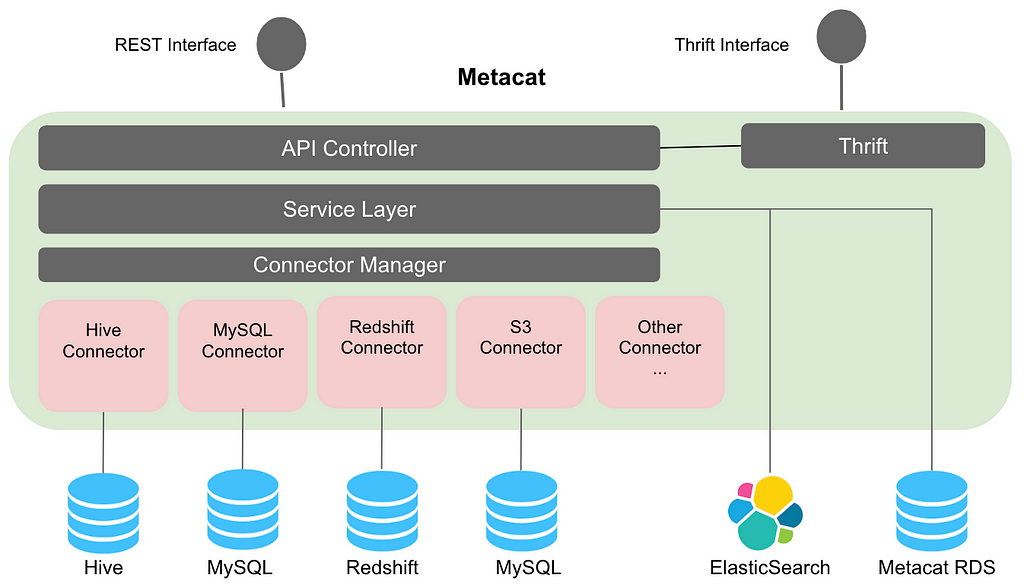
Metacat is a federated service providing a unified REST/Thrift interface to access metadata of various data stores. The respective metadata stores are still the source of truth for schema metadata, so Metacat does not materialize it in its storage. It only directly stores the business and user-defined metadata about the datasets. It also publishes all of the information about the datasets to Elasticsearch for full-text search and discovery.
At a higher level, Metacat features can be categorized as follows:
Data abstraction and interoperability
Business and user-defined metadata storage
Data discovery
Data change auditing and notifications
Hive metastore optimizations
Data Abstraction and Interoperability
Multiple query engines like Pig, Spark, Presto and Hive are used at Netflix to process and consume data. By introducing a common abstraction layer, datasets can be accessed interchangeably by different engines. For example: A Pig script reading data from Hive will be able to read the table with Hive column types in Pig types. For data movement from one datastore to another, Metacat makes the process easy by helping in creating the new table in the destination data store using the destination table data types. Metacat has a defined list of supported canonical data types and has mappings from these types to each respective data store type. For example, our data movement tool uses the above feature for moving data from Hive to Redshift or Snowflake.
The Metacat thrift service supports the Hive thrift interface for easy integration with Spark and Presto. This enables us to funnel all metadata changes through one system which further enables us to publish notifications about these changes to enable data driven ETL. When new data arrives, Metacat can notify dependent jobs to start.
Business and User-defined Metadata
Metacat stores additional business and user-defined metadata about datasets in its storage. We currently use business metadata to store connection information (for RDS data sources for example), configuration information, metrics (Hive/S3 partitions and tables), and tables TTL (time-to-live) among other use cases. User-defined metadata, as the name suggests, is a free form metadata that can be set by the users for their own usage.
Business metadata can also be broadly categorized into logical and physical metadata. Business metadata about a logical construct such as a table is considered as logical metadata. We use metadata for data categorization and for standardizing our ETL processing. Table owners can provide audit information about a table in the business metadata. They can also provide column default values and validation rules to be used for writes into the table.
Metadata about the actual data stored in the table or partition is considered as physical metadata. Our ETL processing stores metrics about the data at job completion, which is later used for validation. The same metrics can be used for analyzing the cost + space of the data. Given two tables can point to the same location (like in Hive), it is important to have the distinction of logical vs physical metadata because two tables can have the same physical metadata but have different logical metadata.
Data Discovery
As consumers of the data, we should be able to easily browse through and discover the various data sets. Metacat publishes schema metadata and business/user-defined metadata to Elasticsearch that helps in full-text search for information in the data warehouse. This also enables auto-suggest and auto-complete of SQL in our Big Data Portal SQL editor. Organizing datasets as catalogs helps the consumer browse through the information. Tags are used to categorize data based on organizations and subject areas. We also use tags to identify tables for data lifecycle management.
Data Change Notification and Auditing
Metacat, being a central gateway to the data stores, captures any metadata changes and data updates. We have also built a push notification system around table and partition changes. Currently, we are using this mechanism to publish events to our own data pipeline (Keystone) for analytics to better understand our data usage and trending. We also publish to Amazon SNS. We are evolving our data platform architecture to be an event-driven architecture. Publishing events to SNS allows other systems in our data platform to “react” to these metadata or data changes accordingly. For example, when a table is dropped, our S3 warehouse janitor services can subscribe to this event and clean up the data on S3 appropriately.
Hive Metastore Optimizations
The Hive metastore, backed by an RDS, does not perform well under high load. We have noticed a lot of issues around writing and reading of partitions using the metatore APIs. Given this, we no longer use these APIs. We have made improvements in our Hive connector that talks directly to the backed RDS for reading and writing partitions. Before, Hive metastore calls to add a few thousand partitions usually timed out, but with our implementation, this is no longer a problem.
Next Steps
We have come a long way on building Metacat, but we are far from done. Here are some additional features that we still need to work on to enhance our data warehouse experience.
Schema and metadata versioning to provide the history of a table. For example, it is useful to track the metadata changes for a specific column or be able to view table size trends over time. Being able to ask what the metadata looked like at a point in the past is important for auditing, debugging, and also useful for reprocessing and roll-back use cases.
Provide contextual information about tables for data lineage. For example, metadata like table access frequency can be aggregated in Metacat and published to a data lineage service for use in ranking the criticality of tables.
Add support for data stores like Elasticsearch and Kafka.
Pluggable metadata validation. Since business and user-defined metadata is free form, to maintain integrity of the metadata, we need validations in place. Metacat should have a pluggable architecture to incorporate validation strategies that can be executed before storing the metadata.
As we continue to develop features to support our use cases going forward, we’re always open to feedback and contributions from the community. You can reach out to us via Github or message us on our Google Group. We hope to share more of what our teams are working on later this year!
And if you’re interested in working on big data challenges like this, we are always looking for great additions to our team. You can see all of our open data platform roles here.
Millions of people visit Netflix every day. Many of them are already Netflix members, looking to enjoy their favorite movies and TV shows, and we work hard to ensure they have a great experience. Others are not yet members, and are looking to better understand our service before signing up.
These prospective members arrive from over 190 countries around the world, and each person arrives with a different set of preferences and intentions. Perhaps they want to see what all the buzz is about and learn what Netflix is, or perhaps they already know what Netflix is and can’t wait to sign up and try out the service. Marketing, social, PR, and word of mouth all help to create awareness and convert that into demand. Growth Engineering collects this demand by helping people sign up, while optimizing for key business metrics such as conversion rate, retention, revenue, etc. We do this by building, maintaining, and operating the backend services that support the signup and login flows that work across mobile phones, tablets, computers and connected televisions.
Let’s take a look at what the Netflix sign up experience looks like for two different customers in two different parts of the world, each with different device types and payment methods. Barb is signing up on a set-top-box (STB) device in the United States and prefers to have her billing done through her cable provider. While Riko is signing up on an iPhone 7 in Japan and prefers to use a credit card.
The customer experience is remarkably different in each of these cases, but the goal is the same. We seek to offer the best possible signup experience to our prospective members while at the same time, remaining extremely lean, agile and efficient in our implementation of these disparate experiences.
Offering an amazing signup experience for thousands of devices in over 190 countries is an incredibly challenging and rewarding task.
The Signup Funnel
The signup funnel is where demand is collected. In general, the signup funnel consists of four parts:
Landing — Welcomes new users and highlights the Netflix value propositions
Plan selection — Highlights our plans and how they differ
Registration — Enables account creation
Payment — Presents payment options and accepts payment
In the signup funnel, we have a short time to get to know our users and we want to help them sign up as efficiently and effectively as possible. How do we know if we’re succeeding at meeting these goals? We experiment constantly. We use A/B testing in order to learn and improve how users navigate the signup funnel. This enables Growth Engineering to be a lean team that has a tremendous and measurable impact on the business.
Why experiment on the signup funnel?
Every visit to the signup funnel is an opportunity to improve the experience for visitors wanting to learn more about Netflix. We’ve learned from experimentation that different customers have different needs and expectations.
Using a TV remote control to navigate the signup flow can be an onerous and time-consuming task. E.g. by leveraging our partnerships, we are able to offer a signup experience with almost no use of the remote control keypad. This enables us to offer a simple and convenient signup experience with integrated billing. The end result is a lower friction signup flow that has improved user experience and business metrics.
Browsers offer additional conveniences that can be leveraged. In particular, local payment options (e.g. paying using direct debit or local credit cards) and browser autofill enable us to offer an optimized signup experience that lets customers sign up for Netflix and start watching great content in just a few minutes.
As these examples highlight, there are many attributes that can be used to optimize a particular flow. By experimenting with different partnerships, payment methods, and user experiences, we are able to affect the membership base growth rate and ultimately, revenue.
How do we experiment on our signup funnel?
Growth Engineering owns the business logic and protocols that allow our UI partners to build lightweight and flexible applications for almost any platform (e.g., iOS, Android, Smart TVs, browsers). Our services speak a custom JSON protocol over HTTP. The protocol is stateless and offers a minimal set of primitives and conventions that enable rapid development of features on almost any platform.
Before diving into core concepts, it’s useful to see where Growth Engineering’s services live within the Netflix microservice ecosystem. Typically, these microservices are implemented in Java and are deployed to AWS on EC2 virtual machines.
Growth Engineering owns multiple services that each provide a specific function to the signup funnel. The Orchestration Service is responsible for validating upstream requests, orchestrating calls to downstream services, and composing JSON responses during a signup flow. We assume requests will fail and use libraries like Hystrix to ensure we are latency and fault tolerant. This enables our customers to have an extremely resilient and reliable sign up experience.
The anatomy of a signup — a closer look
Let’s walk through what it looks like to register for Netflix with a partner-integrated STB device.
Step 1: Request the registration page
The green diamonds and arrows show a successful request path for the registration page.
As you can see, there is a lot of complexity abstracted away in a simple attempt to register for Netflix. In general, processing a request consists of 3 steps:
Validate the request and retrieve necessary state. In this step we check if the request is valid as per the JSON protocol contract. If so, then we hydrate the context object with additional state.
The fully-hydrated context object is then passed to the state machine, which will determine where to take the user next.
JSON response composition. In this final step, we use the context object and the decision from the state machine to compose a response that the UI can consume.
The JSON protocol also enables Growth Engineering to be a source of truth for all events pertaining to the signup funnel. This enables us to centrally collect and monitor all the core sign up related business metrics, thus enabling us to be nimble day-to-day.
What’s next?
As the stewards of the business logic for the signup funnel, Growth Engineering has an incredibly important role at Netflix. Our work directly affects the membership growth rate and as a result, directly impacts Netflix revenue. Although Netflix is more than two years into our journey as a fully global entertainment company, we are only just beginning to understand many of the complicated and intricate consumer preferences that will inform the next set of experiments aimed at improving the signup funnel. We are just beginning to unlock user experience improvements in our international markets.
Netflix has over 125 million members worldwide. The number of global broadband households is over 1 billion and the number of daily internet users is over 4 billion. Growth Engineering is key to making Netflix more accessible for people around the world. Join our team and help us shape the future of global customer acquisition at Netflix.
A glimpse at Spark usage for Netflix Recommendations
Apache Spark has been an immensely popular big data platform for distributed computing. Netflix has been using Spark extensively for various batch and stream-processed workloads. A substantial list of use cases for Spark computation come from the various applications in the domain of content recommendations and personalization. A majority of the machine learning pipelines for member personalization run atop large managed Spark clusters. These models form the basis of the recommender system that backs the various personalized canvases you see on the Netflix app including, title relevance ranking, row selection & sorting, and artwork personalization among others.
Spark provides the computation infrastructure to help develop the models through data preparation, feature extraction, training, and model selection. The Personalization Infrastructure team has been helping scale Spark applications in this domain for the last several years. We believe strongly in sharing our learnings with the broader Spark community and at this year’s Spark +AI Summit in San Francisco, we had the opportunity to do so via three different talks on projects using Spark at Netflix scale. This post summarizes the three talks.
The first talk cataloged our journey building training data infrastructure for personalization models — how we built a fact store for extracting features in an ever-evolving landscape of new requirements. To improve the quality of our personalized recommendations, we try an idea offline using historical data. Ideas that improve our offline metrics are then pushed as A/B tests which are measured through statistically significant improvements in core metrics such as member engagement, satisfaction, and retention. The heart of such offline analyses are historical facts (for example, viewing history of a member, videos in ‘My List’ etc) that are used to generate features required by the machine learning model. Ensuring we capture enough fact data to cover all stratification needs of various experiments and guarantee that the data we serve is temporally accurate is an important requirement.
In the talk, we presented the key requirements, evolution of our fact store design, its push-based architecture, the scaling efforts, and our learnings.
We discussed how we use Spark extensively for data processing for this fact store and delved into the design tradeoffs of fast access versus efficient storage.
Many recommendations for the personalization use cases at Netflix are precomputed in a batch processing fashion, but that may not be quick enough for time sensitive use cases that need to take into account member interactions, trending popularity, and new show launch promotions. With an ever-growing Netflix catalog, finding the right content for our audience in near real-time is a necessary element to providing the best personalized experience.
Our second talk delved into the realtime Spark Streaming ecosystem we have built at Netflix to provide this near-line ML Infrastructure. This talk was contextualized by a couple of product use cases using this near-real-time (NRT) infrastructure, specifically how we select the personalized video to present on the Billboard (large canvas at the top of the page), and how we select the personalized artwork for any title given the right canvas. We also reflected upon the lessons learnt while building a high volume infrastructure on top of Spark Streaming.
With regards to the infrastructure, we talked about:
Scale challenges with Spark Streaming
State management that we had to build on top of Spark
Data persistence
Resiliency, Metrics, and Operational Auto-remediation
Spark-based Stratification library for ML use cases (Shiva Chaitanya)
Our last talk introduced a specific Spark based library that we built to help with stratification of the training sets used for offline machine learning workflows. This allows us to better model our users’ behaviors and provide them great personalized video recommendations.
This library was originally created to implement user selection algorithms in our training data snapshotting infrastructure, but it has evolved to cater to the general-purpose stratification use cases in ML pipelines. The main idea here is to be able to provide a mechanism for down-sampling the data set while still maintaining the desired constraints on the data distribution. We described the flexible stratification API on top of Spark Dataframes.
Choosing Spark+Scala gave us strong type safety in a distributed computing environment. We gave some examples of how, using the library’s DSL one can easily express complex sampling rules.
These talks presented a few glimpses of the Spark usage from the Personalization use cases at Netflix. Spark is also used for many other data processing, ETL, and analytical uses in many other different domains in Netflix. Each domain brings its unique sets of challenges. For the member-facing personalization domain, the infrastructure needs to scale at the level of member scale. That means, for our over 125 million members and each of their active profiles, we need to personalize our content and do so reasonably fast for it to be relevant and timely.
While Spark provides a great horizontally-scalable compute platform, we have found that using some of the advanced features, like code-gen for example, at our scale often poses interesting technical challenges. As Spark’s popularity grows, the project will need to continue to evolve to meet the growing hunger for truly big data sets and do a better job at providing transparency and ease of debugging for the workloads running on it.
This is where sharing lessons from one organization can help benefit the community-at-large. We are happy to share our experiences at such conferences and welcome the ongoing interchange of ideas on making Spark better for modern ML and big data infrastructure use cases.
Imagine you are developing a quick prototype to sift through all the frames of the movie Bright to find the best shots of Will Smith with an action-packed background. Your goal is to get the computer vision algorithm right with high confidence without worrying about:
Parallel processing
Cloud infrastructures like EC2 instances or Docker Container Systems
The location of ultra high definition (UHD) video sources
Cloud storage APIs for saving the results
Retry strategy should the process fail midway
Asset redeliveries from the studios
In the past, our developers have had to think of all of these things and as you can see, it’s quite taxing when the goal is to simply get the algorithm right. In this blog post, we will share our journey into how we built a platform called Archer where everything is handled transparently enabling the users to dive right into the algorithm.
Figure 1: Samples from “Title image selection algorithm” running on Archer
About us
We are Media Cloud Engineering (MCE). We enable high scale media processing which includes media transcoding, trailer generation, and high-quality image processing for artwork. Our compute farm runs tens of thousands of EC2 instances to crank through dynamic workloads. Some examples of compute-hungry use cases include A/B tests, catalog-wide re-encoding for shot-based encoding, and high-quality title images. We handle large-scale distributed computing aspects of the media compute platform and partner closely with Encoding Technologies team for the media standards and codecs.
Our journey
Before Archer, distributed media processing in the cloud was already possible with an in-house developed media processing platform, codename Reloaded. Despite its power and flexibility, development in the Reloaded platform required careful design of dynamic workflow, data model, and distributed workers while observing software development best practices, continuous integration (CI), deployment orchestration, and a staged release train. Although these are the right things to do for feature rollout, it is an impediment and distraction for researchers who just wanted to focus on their algorithms. To gain agility and shield themselves from the distractions of cloud deployment our users were running their experiments on local machines as much as possible. But here the scale was limited. They eventually needed to run their algorithms against a large content catalog to get a better signal.
We looked into distributed computing frameworks like Apache Spark, Kubernetes, and Apache Flink. These frameworks were missing important features like first class support for media objects, custom docker image for each execution, or multi-tenant cluster support with fair resource balancing.
Figure 2: Painful to run large experiments locally
Then we realized that we could combine the best attributes from the Reloaded with the patterns found in the popular distributed computing frameworks and the synthesis mitigated the difficulties mentioned previously, providing an easy-to-use platform that runs at scale for ad-hoc experiments and certain types of production use cases.
Archer
Archer is an easy to use MapReduce style platform for media processing that uses containers so that users can bring their OS-level dependencies. Common media processing steps such as mounting video frames are handled by the platform. Developers write three functions: split, map and collect; and they can use any programming language. Archer is explicitly built for simple media processing at scale, and this means the platform is aware of media formats and gives white glove treatment for popular media formats. For example, a ProRes video frame is a first class object in Archer and splitting a video source into shot based chunks [1] is supported out of the box (a shot is a fragment of the video where the camera doesn’t move).
Many innovative apps have been built using Archer, including an application that detects dead pixels caused by defective digital cameras, an app that uses machine learning (ML) to tag audio and an app that performs automated quality control (QC) for subtitles. We’ll get to more examples later.
Figure 3: Dead pixel detector in action [1]
High-level view
From a 10,000 foot view, Archer has multiple components to run jobs. Everything starts with a REST API to accept the job requests. The workflow engine then picks the request and drives the MapReduce workflow, dispatching work as messages to the priority queue. Application workers listen on the queue and execute the media processing functions supplied by the user. Given the dynamic nature of the work, Archer uses a queue aware scaler to continuously shift resources to ensure all applications get enough compute resources. (See Archer presentation at @Scale 2017 conference for a detailed overview and demo).
Figure 4: High-level architecture of Archer
Simple to use
Simplicity in Archer is made possible with features like efficient access to large files in the cloud, rapid prototyping with arbitrary media files and invisible infrastructure.
MapReduce style — In Archer, users think of their processing job as having three functions: split, map and collect. The job of the split function is to split media into smaller units. The map function applies a media processing algorithm to each split. The collect function combines the results from the map phase. Users can implement all three functions with the programming language of their choice or use built-in functions. Archer provides built-in functions for common tasks such as a shot based video frame splitter and a concatenating collector. It’s very common to build an application by only implementing map function and use built-ins for splitter and collector. Archer users contribute reusable functions to the platform as built-ins.
Video frames as images — Most computer vision (CV) algorithms like to work with JPEG/PNG images to detect complex features like motion estimation and camera shot detection. Video source formats use custom compression techniques to represent original sources, and decoding is needed to convert from the source format to images. To avoid the need to repeat the same code to decode video frames (different for each source format), Archer has a feature to allow users to pick image format, quality, and crop params during job submission.
Container-based runtime — Archer users package their application as a docker image. They run the application locally or in the cloud in the same way. The container-based local development allows users to get an application into a working state quickly and iterate rapidly after that, then with a few commands, the application can be run in the cloud at scale. The Docker-based environment allows users to install operating system (OS) dependencies of their choice and each application can choose their OS-dependencies independent of other applications. For example, experiments run in Archer may install snapshot versions of media tools like ffmpeg and get quick feedback while production apps will depend on released versions. Archer uses Titus (container management platform at Netflix) to run containers at scale.
Figure 6: Run with the same OS dependencies in the cloud at scale
Access to content catalog — Most Archer applications need access to media sources from the Netflix content catalog. The Archer job API offers a content selector that lets users select the playable of their choice as input for their job execution. For example, you can run your algorithm against the UHD video source of the film Bright by just knowing the movie id. There is no need to worry about the location of the video source in the cloud or media format of the source.
Local development — The Developer Productivity team at Netflix has built a tool called Newt (Netflix Workflow Toolkit) to simplify local developer workflows. Archer uses Newt to provide a rich command line interface to make local development easy. Starting a new Archer job or downloading results is just a command away. These commands wrap local docker workflows and interactions with the Archer job API. It’s also easy to build applications in the programming language of choice.
Figure 7: Local development workflow
Enabled by Archer
With a simple platform like Archer, our engineers are free to dream about ideas and realize them in a matter of hours or days. Without Archer to do the heavy lifting, we may not have attempted some of these innovations. Our users leveraged tens of millions of CPU hours to create amazing applications. Some examples:
Dynamic Optimizer — a perceptual video encoding optimization framework.
Subtitle authoring — shot change and burnt-in text location data surfaced by Archer applications are used for subtitle authoring.
Optimal image selection — to find images that are best suited for different canvasses in the Netflix product interface.
Machine assisted QC — to help in various QC phases. This assistance includes text on text detection, audio language checks, and detecting faulty video pixels.
Figure 8: Shot change data generated by Archer application used in subtitle authoring toolFigure 9: Text detection algorithm running on Archer platformFigure 10: Title image picked by an application running on ArcherFigure 11: Artwork image discovery enabled by ArcherFigure 12: Auto-selected best pose for artworkFigure 13: Text occlusion detection enabled by Archer
Wrapping up
Archer is still in active development, and we are continually extending its capabilities and scale. The more experience we have with it, the more possibilities we see. Here are some of the items on our roadmap
SLAs and guaranteed capacity for different users and applications
First-class support for audio sources (we already support video)
A higher degree of runtime isolation between the platform and application
Rich development experience for Python users
In an upcoming blog post, we will be writing about the secure media storage service that underpins Archer and other projects at Netflix.
The Archer platform is still relatively new. But the concept is daily being validated by the many teams at Netflix who are adopting it and producing innovative advances in the Netflix product. Enthusiasm and usage are growing, and so also is our need for engineering talent. If you are excited to work on large-scale distributed computing problems in media processing and think out of the box by applying machine learning and serverless concepts, we are hiring (MCE, Content Engineering). Also, check out research.netflix.com to learn more about research & data science at Netflix.
References
[1] S. Bhattacharya, A. Prakash, and R. Puri, Towards Scalable Automated Analysis of Digital Video Assets for Content Quality Control Applications, SMPTE 2017 Annual Technical Conference, and Exhibition, Hollywood & Highland, Los Angeles, California, 2017
Over the past three years, Netflix has been investing in container technology. A large part of this investment has been around Titus, Netflix’s container management platform that was open sourced in April of 2018. Titus schedules application containers to be run across a fleet of thousands of Amazon EC2 instances.
Early on Titus focused on supporting simple batch applications and workloads that had a limited set of feature and availability requirements. As several internal teams building microservices wanted to adopt containers, Titus began to build scheduling support for service applications. However, supporting services, especially those in the customer critical path, required Titus to provide a much richer set of production ready features. Since Netflix’s migration to AWS began almost a decade earlier, microservices have been built atop EC2 and heavily leverage AWS and internal Netflix infrastructure services. The set of features used by an internal service then drove if or how that service could leverage Titus.
One of the most commonly used service features is auto scaling. Many microservices are built to be horizontally scalable and leverage Amazon EC2 Auto Scaling to automatically add or remove EC2 instances as the workload changes. For example, as people on the east coast of the U.S. return home from work and turn on Netflix, services automatically scale up to meet this demand. Scaling dynamically with demand rather than static sizing helps ensure that services can automatically meet a variety of traffic patterns without service owners needing to size and plan their desired capacity. Additionally, dynamic scaling enables cloud resources that are not needed to be used for other purposes, such as encoding new content.
As services began looking at leveraging containers and Titus, Titus’s lack of an auto scaling feature became either a major hurdle or blocker for adoption. Around the time that we were investigating building our own solution, we engaged with the AWS Auto Scaling team to describe our use case. As a result of Netflix’s strong relationship with AWS, this discussion and several follow ups led to the design of a new AWS Application Auto Scaling feature that allows the same auto scaling engine that powers services like EC2 and DynamoDB to power auto scaling in a system outside of AWS like Titus.
This design centered around the AWS Auto Scaling engine being able to compute the desired capacity for a Titus service, relay that capacity information to Titus, and for Titus to adjust capacity by launching new or terminating existing containers. There were several advantages to this approach. First, Titus was able to leverage the same proven auto scaling engine that powers AWS rather than having to build our own. Second, Titus users would get to use the same Target Tracking and Step Scaling policies that they were familiar with from EC2. Third, applications would be able to scale on both their own metrics, such as request per second or container CPU utilization, by publishing them to CloudWatch as well as AWS-specific metrics, such as SQS queue depth. Fourth, Titus users would benefit from the new auto scaling features and improvements that AWS introduces.
The key challenge was enabling the AWS Auto Scaling engine to call the Titus control plane running in Netflix’s AWS accounts. To address this, we leveraged AWS API Gateway, a service which provides an accessible API “front door” that AWS can call and a backend that could call Titus. API Gateway exposes a common API for AWS to use to adjust resource capacity and get capacity status while allowing for pluggable backend implementations of the resources being scaled, such as services on Titus. When an auto scaling policy is configured on a Titus service, Titus creates a new scalable target with the AWS Auto Scaling engine. This target is associated with the Titus Job ID representing the service and a secure API Gateway endpoint URL that the AWS Auto Scaling engine can use. The API Gateway “front door” is protected via AWS Service Linked Roles and the backend uses Mutual TLS to communicate to Titus.
Configuring auto scaling for a Titus service works as follows. A user creates a service application on Titus, in this example using Spinnaker, Netflix’s continuous delivery system. The figure below shows configuring a Target Tracking policy for a Node.js application on the Spinnaker UI.
Using the Spinnaker UI to configure a Titus auto scaling policy.
The Spinnaker policy configuration also defines which metrics to forward to CloudWatch and the CloudWatch alarm settings. Titus is able to forward metrics to CloudWatch using Atlas, Netflix’s telemetry system. These metrics include those generated by the application and the container-level system metrics collected by Titus. When metrics are forwarded to Atlas they include information that associates them with the service’s Titus Job ID and whether Atlas should also forward them to CloudWatch.
Once a user has selected policy settings on Spinnaker, Titus associates the service with a new scalable resource within the AWS Auto Scaling engine. This process is shown in the figure below. Titus configures both the AWS Auto Scaling policies and CloudWatch alarms for the service. Depending on the scaling policy type, Titus may explicitly create the CloudWatch alarm or AWS automatically may do it, in the case of Target Tracking policies.
Titus auto scaling workflow.
As service apps running on Titus emit metrics, AWS analyzes the metrics to determine whether CloudWatch alarm thresholds are being breached. If an alarm threshold has been breached, AWS triggers the alarm’s associated scaling actions. These actions result in calls to the configured API Gateway endpoints to adjust instance counts. Titus responds to these calls by scaling up or down the Job accordingly. AWS monitors both the results of these scaling requests and how metrics change.
Providing an auto scaling feature that allowed Titus users to configure scaling policies the same way they would on EC2 greatly simplified adoption. Rather than coupling the adoption of containers with new auto scaling technology, Titus was able to provide the benefits of using containers with well tested auto scaling technology that users and their tools already understood. We followed the same pattern of leveraging existing AWS technology instead of building our own for several Titus features, such as networking, security groups, and load balancing. Additionally, auto scaling drove Titus availability improvements to ensure it was capable of making fast, online capacity adjustments. Today, this feature powers services that many Netflix customers interact with every day.
Up until today, Titus has leveraged this functionality as a private AWS feature. We are happy that AWS has recently made this feature generally available to all customers as Custom Resource Scaling. Beyond container management platforms like Titus, any resource that needs scaling, like databases or big data infrastructure, can now leverage AWS Auto Scaling. In addition to helping drive key functionality for Titus, we are excited to see Netflix’s collaboration with AWS yield new features for general AWS customers.
In 2013, we introduced EVCache a distributed in-memory caching solution based on memcached that offers low-latency, high-reliability caching and storage. It is well integrated with AWS and EC2, a Netflix OSS project, and in many occasions it is termed as “the hidden microservice”. Since then, EVCache has become a fundamental tier-0 service storing petabytes of data and hundred of billions of items, performing trillions of operations per day, has the ability to persist the data to the disk, and has a footprint of thousands of servers in three AWS regions.
Motivation
With the advent of Netflix global cloud architecture we are able to serve requests for a Netflix customer from any AWS region where we are deployed. The diagram below shows the logical structure of our multi-region deployment and the default routing of member traffic to AWS region.
As we started moving towards the Global Cloud, we had a three times increase in the data that needed to be replicated and cached in each region. We also needed to move this data swiftly and securely across all regions. Supporting these features came at a considerable increase in cost and complexities. Our motivation was to provide a global caching solution which was not only fast but was also cost effective.
SSDs for Caching
Storing large amounts of data in volatile memory (RAM) is expensive. Modern disk technologies based on SSD are providing fast access to data but at a much lower cost when compared to RAM. Hence, we wanted to move part of the data out of memory without sacrificing availability or performance. The cost to store 1 TB of data on SSD is much lower than storing the same amount in RAM.
We observed during experimentation that RAM random read latencies were rarely higher than 1 microsecond whereas typical SSD random read speeds are between 100–500 microseconds. For EVCache our typical SLA (Service Level Agreement) is around 1 millisecond with a default timeout of 20 milliseconds while serving around 100K RPS. During our testing using the storage optimized EC2 instances (I3.2xlarge) we noticed that we were able to perform over 200K IOPS of 1K byte items thus meeting our throughput goals with latency rarely exceeding 1 millisecond. This meant that by using SSD (NVMe) we were able to meet our SLA and throughput requirements at a significantly lower cost.
Background
EVCache Moneta was our first venture at using SSD to store data. The approach we chose there was to store all the data on SSD (RocksDB) and the active/hot data in RAM (Memcached). This approach reduced the size of most Moneta based clusters over 60% as compared to their corresponding RAM-only clusters. It worked well for Personalization & Recommendation use cases where the personalization compute systems periodically compute the recommendations for every user and use EVCache Moneta to store the data. This enabled us to achieve a significant reduction in cost for personalization storage clusters.
EVCache Moneta
However, we were unable to move some of the large online and customer facing clusters as we hit performance and throughput issues while overwriting existing data (due to compactions) on RocksDB. We would also exceed the desired SLA at times. As we were working towards solving these issues, Memcached External Storage (extstore), which had taken a different approach in using NVMe based storage devices, was announced.
Memcached External Storage (extstore)
Memcached provides an external storage shim called extstore, that supports storing of data on SSD (I2) and NVMe (I3). extstore is efficient in terms of cost & storage device utilization without compromising the speed and throughput. All the metadata (key & other metadata) is stored in RAM whereas the actual data is stored on flash.
With extstore we are able to use the storage device completely and more efficiently which we could not do achieve with Moneta. On Moneta based systems we could use at most 50% of the disc capacity as we had to ensure an old item could be deleted (FIFO compaction) only after it was written again. This meant we had could end up with a copy of new and old data for every item thus having a need for 50% disc utilization. Since we did not have need for storing duplicate records in extstore we are able to reduced the cost of extstore based EVCache clusters significantly. At this point, most of the EVCache clusters are scaled to meet network demands rather than storage demands. This has been quite a remarkable achievement.
By moving from Moneta based clusters to extstore we are also able to take full advantage of the asynchronous metadump command (lru_crawler), which allows us to iterate through all of the keys in an instance. We use this to warm up a new cluster when we deploy a new version of memcached or scale the clusters up or down. By taking advantage of this command we can also take snapshot of the data at regular intervals or whenever we need. This ensures data in EVCache is durable and highly available in case of a disaster.
The performance is also consistent compared to Moneta and rarely exceeds our SLA. Below is a log of disc access via iosnoop for read operations from one of the production cluster which is used to store users personalized recommendations.
Below is a histogram plot of the read latencies from the log above. The majority of reads are around 100 microseconds or less.
Below is the average read latency of one of cache comparing Moneta (blue) vs extstore (read). extstore latencies are consistently lower than Moneta for similar load across both the instances.
Conclusion
With extstore we are able to handle all types of workloads whether it is a read heavy, write heavy or balanced. We are also able to handle data sets ranging from gigabytes to petabytes while maintaining consistent performance.
It has been quite a journey to move from Moneta to extstore and as of now we have moved all our production clusters running Moneta to extstore. We have also been able to move some of the large RAM based memcached clusters to considerably smaller extstore clusters. The new architecture for EVCache Server running extstore is allowing us to continue to innovate in ways that matter. There’s still much to do and If you want to help solve this or similar big problems in cloud architecture, join us.
Netflix Cloud Security SIRT releases Diffy: A Differencing Engine for Digital Forensics in the Cloud
Forest Monsen and Kevin Glisson, Netflix Security Intelligence and Response Team
Can you spot the difference? Hint: it’s not the bow tie.
The Netflix Security Intelligence and Response Team (SIRT) announces the release of Diffy under an Apache 2.0 license. Diffy is a triage tool to help digital forensics and incident response (DFIR) teams quickly identify compromised hosts on which to focus their response, during a security incident on cloud architectures.
Features
Efficiently highlights outliers in security-relevant instance behavior. For example, you can use Diffy to tell you which of your instances are listening on an unexpected port, are running an unusual process, include a strange crontab entry, or have inserted a surprising kernel module.
Uses one, or both, of two methods to highlight differences: 1) Collection of a “functionalbaseline” from a “clean” running instance, against which your instance group is compared, and 2) a “clustering” method, in which all instances are surveyed, and outliers are made obvious.
Uses a modular plugin-based architecture. We currently include plugins for collection using osquery via AWS EC2 Systems Manager (formerly known as Simple Systems Manager or SSM).
Why is Diffy useful?
Digital Forensics and Incident Response (DFIR) teams work in a variety of environments to quickly address threats to the enterprise. When operating in a cloud environment, our ability to work at scale, with imperative speed, becomes critical. Can we still operate? Do we have what we need?
When moving through systems, attackers may leave artifacts — signs of their presence — behind. As an incident responder, if you’ve found one or two of these on disk or in memory, how do you know you’ve found all the instances touched by the attackers? Usually this is an iterative process; after finding the signs, you’ll search for more on other instances, then use what you find there to search again, until it seems like you’ve got them all. For DFIR teams, quickly and accurately “scoping a compromise” is critical, because when it’s time to eradicate the attackers, it ensures you’ll really kick them out.
Since we don’t yet have a system query tool broadly deployed to quickly and easily interrogate large groups of individual instances (such as osquery), we realized in cases like these we would have some difficulty in determining exactly which instances needed closer examination, and which we could leave for later.
We’ve scripted solutions using SSH, but we’ve also wanted to create an easier, more repeatable way to address the issue.
How does Diffy work?
Diffy finds outliers among a group of very similar hosts (e.g. AWS Auto Scaling Groups) and highlights those for a human investigator, who can then examine those hosts more closely. More importantly, Diffy helps an investigator avoid wasting time in forensics against hosts that don’t need close examination.
How does Diffy do this? Diffy implements two methods to find outliers: a “functionalbaseline” method (implemented now), and a “clustering” method (to be implemented soon).
Functional baseline
How does the “functional baseline” method work?
Osquery table output representing system state is collected from a single newly-deployed representative instance and stored for later comparison.
During an incident, osquery table output is collected from all instances in an application group.
Instances are compared to the baseline. Suspicious differences are highlighted for the investigator’s follow-up.
When is the functional baseline useful?
When you have very few instances in an application group / low n.
When you have had the foresight or established process to successfully collect the baseline beforehand.
Clustering
How does the “clustering” method work?
During an incident, osquery table output is collected from all instances in an application group.
No pre-incident baseline need be collected.
A clustering algorithm is used to identify dissimilar elements in system state (for example, an unexpected listening port, or a running process with an unusual name).
When is the clustering method useful?
When you have many instances in an application group.
When instances in an application group are expected to be very similar (in which case outliers will stick out quite noticeably).
When you are not able to collect a baseline for the application group beforehand.
Integrating into the CI/CD pipeline
In environments supporting continuous integration or continuous delivery (CI/CD) such as ours, software is frequently deployed through a process involving first the checkout of code from a source control system, followed by the packaging of that code into a form combined (“baked”) into a system virtual machine (VM) image. The VM is then copied to a cloud provider, and started up as a VM instance in the cloud architecture. You can read more about this process in “How We Build Code at Netflix.”
Diffy provides an API for application owners to call at deploy time, after those virtual machine instances begin serving traffic. When activated, Diffy deploys a system configuration and management tool called osquery to the instance (if it isn’t already present) and collects a baseline set of observations from the system by issuing SQL commands. We do this on virtual machines, but osquery can do this on containers as well.
State diagram for Diffy’s functional baselining method
During an incident
When an incident occurs, an incident responder can use Diffy to interrogate an ASG: first pulling the available baseline, next gathering current observations from all instances there, and finally comparing all instances within the ASG against that baseline. Instances that differ from the baseline in interesting, security-relevant ways are highlighted, and presented to the investigator for follow-up. If the functional baseline wasn’t previously collected, Diffy can rely solely on the clustering method. We’re not settled on the algorithm yet, but we see Diffy collecting observations from all instances in an ASG, and using the algorithm to identify outliers.
Summary
In today’s cloud architectures, automation wins. Digital forensics and incident response teams need straightforward help to help them respond to compromises with swift action, quickly identifying the work ahead. Diffy can help those teams.
We’ve characterized Diffy as one of our “Skunkworks” projects, meaning that the project is under active development and we don’t expect to be able to provide support, or a public commitment to improve the software. To download the code, visit https://github.com/Netflix-Skunkworks/diffy. If you’d like to contribute, take a look at our Contributor Guidelines at https://diffy.readthedocs.io/ to get started on your plugin and send us a pull request. Oh, and we’re hiring — if you’d like to help us solve these sorts of problems, take a look at https://jobs.netflix.com/teams/security, and reach out!
In the past 8 years Netflix has transformed from an English-only product, to now supporting 26 languages and growing. As we add language support for our members residing in 190 different countries, scaling globalization at Netflix has never been more important. Along the way we’ve built out countless solutions to help us achieve globalization at scale. In this article we’ll focus on one my team has been working on, Pseudo Localization.
The problem
The problem we set out to solve was simple: Expansion of text due to translation causes most of the UI layout issues we detect during localization testing.
When translating into other languages, the translated text could be up to 40% longer than the English. This is more prevalent in German, Hebrew, Polish, Finnish, and Portuguese. Take this real-world example from our German UI :
Don’t miss out.
Translated into German, this becomes much longer! :
Lassen Sie sich nichts entgehen!
Put in the context of the UI, we see problems:
This is one example among many. The source of the problem is that our UIs are designed in English, and assume English string lengths, line heights, and glyphs. More often than not, when those strings are translated we will see expansion that causes layout issues. When the product is translated into 26 languages, like ours is, you potentially end up with 26 defects that need to be logged, managed, and resolved; all the while we had the opportunity to fix the issue at the English design phase, before translation ever started.
The solution
Enter Pseudo Localization. Pseudo Localization is a way to simulate translation of English UI strings, without waiting for, or going to the effort of doing real translation. Think of it as a fake translation that remains readable to an English speaking developer, and allows them to test for translation related expansion, among other important things. Here’s an example of our Netflix Pseudo Localization in action on iOS:
It helps to break down what we’re doing here, using the following string as an example:
Find Help Online
After passing through our Pseudo Localization algorithm it becomes this:
[ƒîกี้ð Ĥéļþ Öกี้ļîกี้é one two]
Here are the various elements of the transform:
Start and end markers: All strings are encapsulated in [ ]. If a developer doesn’t see these characters they know the string has been clipped by an inflexible UI element.
Transformation of ASCII characters to extended character equivalents: Stresses the UI from a vertical line height perspective, tests font and encoding support, and weeds out strings that haven’t been externalized correctly (they will not have the Pseudo Localization applied to them).
Padding text: Simulates translation induced expansion. In our case we add “one two three four”…etc after each string, simulating 40% expansion. Note that we don’t apply expansion to areas of the UI where text length has already been limited by other systems prior to display on the UI, doing so would cause false positives ( e.g. synopsis text, titles, etc ).
Pseudo Localization on our TV platform
Under The Hood
We are lucky enough to leverage our cloud based Global String Repository, for this effort. We apply the Pseudo Localization transformations on any string requested from the repository, before it is handed off to the client. The transformation logic resides in our Netflix Internationalization library, NFi18n, and is available by API to all other Netflix services. The beauty of this solution is that it can be applied to all of our supported UIs.
One of the biggest challenges we faced was text that displays on our UIs but doesn’t originate from our Global Strings Repository. Examples of this type of text would be movie/show titles, synopsis, cast names, maturity ratings, to name a few. This “movie metadata” lives in various systems across Netflix so we had some investigation to do to figure out where, and when was the best place and time to apply our Pseudo Localization transforms on this metadata. Having all this additional text pseudo localized was important because without the pseudo localized metadata, the experience felt incomplete, half pseudo localized, half English:
Implementation was only half the battle
Going into this project, we knew that driving implementation across the various UI development teams at Netflix would be critical to success. It didn’t matter how good our solution was if nobody was using it. We put a lot of investment into the following areas:
Training and education: everyone had to know what it was, and why we wanted them to use it. We had to demonstrate impact.
Ease of use: we had to make it as easy as possible for development teams to integrate with our solution. Adding any type of friction wasn’t an option.
Opt-out: we wanted the Netflix Pseudo Localization service to be opt-out. What this meant was Pseudo Localization was the default development language for all UI developers, when they run their debug builds, they see Pseudo Localization. We were effectively asking every UI developer to fundamentally change the way they work.
Learnings
We correctly assumed that architecting, and implementing the solution would not be half of the battle, I would argue it was even less. The real work starts while advocating, influencing, educating, and convincing development teams to fundamentally change the way they work. We did this by showing the impact that Pseudo Localization can have and the amounts of defects it can eradicate, that they fix a UI layout issue once, instead of 26 times. Already we are seeing UI engineers catching and fixing UI layout issues that previously we would have caught post-translation in multiple languages. Now they can simply find and fix it once themselves.
What’s next?
About 6 weeks after the initial rollout to development teams, we surveyed all our developers. Areas we touched on were:
What would you like to see improved?
If you turned it off, why?
Do you understand the value of Pseudo Localization?
How can we make it easier for you?
Have you caught layout issues using Pseudo Localization?
Based on the survey, the resounding theme was readability. While we had maintained readability, we had introduced additional overhead in parsing the text on screen while reading. Because of this we will look to simplify our transforms to something less egregious, while still retaining the useful elements of Pseudo Localization. We also heard feedback about the expansion text we add, “one two three four…”, it feels unnatural and can cause confusion around if the text is expansion text, or if it’s a placeholder / variable in the UI. As a result we will investigate other ways of simulating expansion, one option is to multiply vowels to achieve the same result, e.g.:
Before: [ƒîกี้ð Ĥéļþ Öกี้ļîกี้é one two]
After: [ƒîîîกี้ð Ĥéééļþ ÖÖกี้ļîîîกี้ééé]
Come work with us!
If you’re interested in working on high impact projects like the one we’ve talked about here, I have openings on my Internationalization team. Check out the role we have posted, and feel free to connect with me on LinkedIn!
Will Bengtson, Netflix Security Tools and Operations
Credential compromise is an important concern for anyone operating in the cloud. The problem becomes more obvious over time, as organizations continue to adopt cloud resources as part of their infrastructure without maintaining an accompanying capability to observe and react to these compromises. The associated impacts to these compromises vary widely as well. Attackers might use this for something as straightforward as stealing time and CPU on your instances to mine Bitcoin, but it could be a lot worse; credential compromise could lead to deletion of infrastructure and stolen data.
We on the Netflix Security Tools and Operations team want to share a new methodology for detecting temporary security credential use outside of your AWS environment. Consider your AWS environment to be “all those AWS resources that are associated with your AWS accounts.”
Advantages
You’ll be able to detect API Calls with AWS EC2 temporary security credentials outside of your environment without any prior knowledge of your IP allocations in AWS.
You’ll go from zero to full coverage in six hours or less.
The methodology can be applied in real time, as well as on historical AWS CloudTrail data, to determine potential compromise.
Scope
In this post, we’ll show you how to detect compromised AWS instance credentials (STS credentials) outside of your environment. Keep in mind, however, that you could do this with other temporary security credentials, such as ECS, EKS, etc.
Why is this useful?
Attackers understand where your applications run, as well as common methods of detecting credential compromise. When attacking AWS, attackers will often try to use your captured AWS credentials from within their AWS account. Perhaps you’re already paying attention to invocations of the “dangerous” AWS API calls in your environment — which is a great first step — but attackers know what will get your attention, and are likely to try innocuous API calls first. The obvious next step is to determine if API calls are happening from outside of your environment. Right now, because the more general AWS IP space is well-known, it’s easy to detect if API calls originate from outside of AWS. If they originate from AWS IPs other than your own, however, you’ll need some extra magic. That’s the methodology we’re publicizing here.
How does it work?
To understand our method, you first need to know how how AWS passes credentials to your EC2 instance, and how to analyze CloudTrail entries record by record.
We’ll first build a data table of all EC2 assumed role records, culled from CloudTrail. Each table entry shows the instance ID, assumed role, IP address of the API call, and a TTL entry (the TTL helps keep the table lean). We can quickly determine if the caller is within our AWS environment by examining the source IP address of the API call from an instance.
Assume Role
When you launch an EC2 instance with an IAM Role, the AWS EC2 service assumes the role specified for the instance and passes those temporary credentials to the EC2 metadata service. This AssumeRole action appears in CloudTrail with the following key fields:
We can determine the Amazon Resource Name (ARN) for these temporary instance credentials from this Cloud Trail log. Note that AWS refreshes credentials in the EC2 metadata service every 1–6 hours.
When we see an AssumeRole action by the EC2 service, let’s store it in a table with the following columns:
Instance-Id AssumedRole-Arn IPs TTL
We can get the Instance-Id from the requestParameters.roleSessionNamefield. For each AssumeRole action, let’s check to see if a row already exists in our table. If not, we will create one.
If the row exists, let’s update the TTL to keep it around. At this point we update the TTL; since the instance is still up and running, we don’t want this entry to expire. A safe TTL in this case is 6 hours, due to the periodic refreshing of instance credentials within AWS, but you may decide to make it longer. You can construct the AssumedRole-Arn by taking the requestParameters.roleArn and requestParameters.roleSessionName from the AssumeRole CloudTrail record.
For example, the resulting AssumedRole-Arn for the above entry is:
This AssumeRole-Arn becomes your userIdentity.arn entry in CloudTrail for all calls that use these temporary credentials.
AssumedRole Calls
Now that we have a table of Instance-IDs and AssumeRole-ARNs, we can start analyzing each CloudTrail record using these temporary credentials. Each instance-id/session row starts without an IP address to lock to (remember, we claimed that with this method, you won’t need to know all your IP addresses in advance).
For each CloudTrail event, we will analyze the type of record to make sure it came from an assumed role. You can do this by checking the value of userIdentity.type and making sure it equals AssumedRole. If it is AssumedRole, we will grab the userIdentity.arn field which is equivalent to the AssumeRole-Arn column in the table. Since the userIdentity.arn has the requestParameters.roleSessionName in the value, we can extract the instance-id and do a lookup in the table to see if a row exists. If the row exists, we then check to see if there are any IPs that this AssumeRole-Arn is locked to. If there aren’t any, then we update the table with the sourceIPAddress from the record and this becomes our IP address that all calls should come from. And here’s the key to the whole method: If we see a call with a sourceIPAddress that doesn’t match the previously observed IP, then
we have detected a credential being used on an instance other than the one to which it was assigned, and we can assume that credential has been compromised.
For CloudTrail events that do not have a corresponding row in the table, we’ll just have to discard these, because we can’t make a decision without a corresponding entry in the table. However, we’ll only face this shortcoming for up to six hours, due to the way AWS handles temporary instance credentials within EC2. After that point we’ll have all of the AssumeRole entries for our environment, and we won’t need to discard any events.
Edge Cases
To prevent false positives, you’ll want to consider a few edge cases that impact this approach:
For certain API calls, AWS will use your credentials and make calls on your behalf.
If you have an AWS VPC Endpoint for your service, calls to these will show up in the logs as associated with a private IP address.
If you attach a new ENI or associate a new address to your instance, you’ll see additional IPs for that AssumedRole-Arn show up in CloudTrail.
AWS Makes Calls on Your Behalf
If you look in your CloudTrail records, you may find that you see a sourceIPAddress that shows up as <servicename>.amazonaws.com outside of the AssumeRole action mentioned earlier. You will want to account for these appearing and trust AWS in these calls. You might still want to keep track of these and provide informational alerting.
AWS VPC Endpoints
When you make an API call in a VPC that has a VPC endpoint for your service, the sourceIPAddress will show up as a private IP address instead of the public IP address assigned to your instance or your VPC NAT Gateway. You will most likely need to account for having a [public IP, private IP] list in your table for a given instance-id/AssumeRole-Arn row.
Attaching a New ENI or Associating a New Address to Your Instance
You might have a use case where you attach additional ENI(s) to your EC2 instance or associate a new address through use of an Elastic IP (EIP). In these cases, you will see additional IP(s) show up in CloudTrail records for your AssumedRole-Arn. You will need to account for these actions in order to prevent false positives. One way to address this edge case is to inspect the CloudTrail records which associate new IPs to instances and create a table that has a row for each time a new IP was associated with the instance. This will account for the number of potential IP changes that you come across in CloudTrail. If you see a sourceIPAddress that does not match your lock IP, check to see if there was a call that resulted in a new IP for your instance. If so, add this IP to your IP column in your AssumeRole-Arn table entry, remove the entry in the additional table where you track associations, and do not alert.
Attacker Gets to it First
You might be asking the question: “Since we set the lock IP to the first API call seen with the credentials, isn’t there a case where an attacker’s IP is set to the lock IP?” Yes, there is a slight chance that due to this approach you add an attacker’s IP to the lock table because of a compromised credential. In this rare case, you will detect a “compromise” when your EC2 instance makes its first API call after the lock of the attacker’s IP. To minimize this rare case, you might add a script that executes the first time your AWS instance boots and makes an AWS API call that is known to be logged in CloudTrail.
Summary
The methodology we’ve shared here requires a high level of familiarity with CloudTrail, and how AssumeRole calls are logged. However, there are several advantages, including scalability, as your AWS environment grows and your number of accounts increases, and simplicity, since with this method you needn’t maintain a full list of IP addresses allocated to your account. Do bear in mind the “defense in depth” truism: this should only constitute one “layer” of your security tactics in AWS.
Be sure to let us know if you implement this, or something better, in your own environment.
Will Bengtson, for Netflix Security Tools and Operations
Notebooks have rapidly grown in popularity among data scientists to become the de facto standard for quick prototyping and exploratory analysis. At Netflix, we’re pushing the boundaries even further, reimagining what a notebook can be, who can use it, and what they can do with it. And we’re making big investments to help make this vision a reality.
In this post, we’ll share our motivations and why we find Jupyter notebooks so compelling. We’ll also introduce components of our notebook infrastructure and explore some of the novel ways we’re using notebooks at Netflix.
If you’re short on time, we suggest jumping down to the Use Cases section.
Making this possible is no small feat; it requires extensive engineering and infrastructure support. Every day more than 1 trillion events are written into a streaming ingestion pipeline, which is processed and written to a 100PB cloud-native data warehouse. And every day, our users run more than 150,000 jobs against this data, spanning everything from reporting and analysis to machine learning and recommendation algorithms. To support these use cases at such scale, we’ve built an industry-leading data platform which is flexible, powerful, and complex (by necessity). We’ve also built a rich ecosystem of complementary tools and services, such as Genie, a federated job execution service, and Metacat, a federated metastore. These tools simplify the complexity, making it possible to support a broader set of users across the company.
User diversity is exciting, but it comes at a cost: the data platform — and its ecosystem of tools and services — must scale to support additional use cases, languages, access patterns, and more. To better understand this problem, consider 3 common roles: analytics engineer, data engineer, and data scientist.
Example of how tooling & language preferences may vary across roles
Generally, each role relies on a different set of tools and languages. For example, a data engineer might create a new aggregate of a dataset containing trillions of streaming events — using Scala in IntelliJ. An analytics engineer might use that aggregate in a new report on global streaming quality — using SQL and Tableau. And that report might lead to a data scientist building a new streaming compression model — using R and RStudio. On the surface, these seem like disparate, albeit complementary, workflows. But if we delve deeper, we see that each of these workflows has multiple overlapping tasks:
data exploration — occurs early in a project; may include viewing sample data, running queries for statistical profiling and exploratory analysis, and visualizing data
data preparation — iterative task; may include cleaning, standardizing, transforming, denormalizing, and aggregating data; typically the most time-intensive task of a project
data validation — recurring task; may include viewing sample data, running queries for statistical profiling and aggregate analysis, and visualizing data; typically occurs as part of data exploration, data preparation, development, pre-deployment, and post-deployment phases
productionalization — occurs late in a project; may include deploying code to production, backfilling datasets, training models, validating data, and scheduling workflows
To help our users scale, we want to make these tasks as effortless as possible. To help our platform scale, we want to minimize the number of tools we need to support. But how? No single tool could span all of these tasks; what’s more, a single task often requires multiple tools. When we add another layer of abstraction, however, a common pattern emerges across tools and languages: run code, explore data, present results.
As it happens, an open source project was designed to do precisely that: Project Jupyter.
Jupyter Notebooks
Jupyter notebook rendered in nteract desktop featuring Vega and Altair
Project Jupyter began in 2014 with a goal of creating a consistent set of open-source tools for scientific research, reproducible workflows, computational narratives, and data analytics. Those tools translated well to industry, and today Jupyter notebooks have become an essential part of the data scientist toolkit. To give you a sense of its impact, Jupyter was awarded the 2017 ACM Software Systems Award — a prestigious honor it shares with Java, Unix, and the Web.
To understand why the Jupyter notebook is so compelling for us, consider the core functionality it provides:
a messaging protocol for introspecting and executing code which is language agnostic
an editable file format for describing and capturing code, code output, and markdown notes
a web-based UI for interactively writing and running code as well as visualizing outputs
The Jupyter protocol provides a standard messaging API to communicate with kernels that act as computational engines. The protocol enables a composable architecture that separates where content is written (the UI) and where code is executed (the kernel). By isolating the runtime from the interface, notebooks can span multiple languages while maintaining flexibility in how the execution environment is configured. If a kernel exists for a language that knows how to communicate using the Jupyter protocol, notebooks can run code by sending messages back and forth with that kernel.
Backing all this is a file format that stores both code and results together. This means results can be accessed later without needing to rerun the code. In addition, the notebook stores rich prose to give context to what’s happening within the notebook. This makes it an ideal format for communicating business context, documenting assumptions, annotating code, describing conclusions, and more.
Use Cases
Of our many use cases, the most common ways we’re using notebooks today are: data access, notebook templates, and scheduling notebooks.
Data Access
Notebooks were first introduced at Netflix to support data science workflows. As their adoption grew among data scientists, we saw an opportunity to scale our tooling efforts. We realized we could leverage the versatility and architecture of Jupyter notebooks and extend it for general data access. In Q3 2017 we began this work in earnest, elevating notebooks from a niche tool to a first-class citizen of the data platform.
From our users’ perspective, notebooks offer a convenient interface for iteratively running code, exploring output, and visualizing data — all from a single cloud-based development environment. We also maintain a Python library that consolidates access to platform APIs. This means users have programmatic access to virtually the entire platform from within a notebook. Because of this combination of versatility, power, and ease of use, we’ve seen rapid organic adoption for all user types across the entire Data Platform.
Today, notebooks are the most popular tool for working with data at Netflix.
Notebook Templates
As we expanded platform support for notebooks, we began to introduce new capabilities to meet new use cases. From this work emerged parameterized notebooks. A parameterized notebook is exactly what it sounds like: a notebook which allows you to specify parameters in your code and accept input values at runtime. This provides an excellent mechanism for users to define notebooks as reusable templates.
Our users have found a surprising number of uses for these templates. Some of the most common ones are:
Data Scientist: run an experiment with different coefficients and summarize the results
Data Engineer: execute a collection of data quality audits as part of the deployment process
Data Analyst: share prepared queries and visualizations to enable a stakeholder to explore more deeply than Tableau allows
Software Engineer: email the results of a troubleshooting script each time there’s a failure
Scheduling Notebooks
One of the more novel ways we’re leveraging notebooks is as a unifying layer for scheduling workflows.
Since each notebook can run against an arbitrary kernel, we can support any execution environment a user has defined. And because notebooks describe a linear flow of execution, broken up by cells, we can map failure to particular cells. This allows users to describe a short narrative of execution and visualizations that we can accurately report against when running at a later point in time.
This paradigm means we can use notebooks for interactive work and smoothly move to scheduling that work to run recurrently. For users, this is very convenient. Many users construct an entire workflow in a notebook, only to have to copy/paste it into separate files for scheduling when they’re ready to deploy it. By treating notebooks as a logical workflow, we can easily schedule it the same as any other workflow.
We can schedule other types of work through notebooks, too. When a Spark or Presto job executes from the scheduler, the source code is injected into a newly-created notebook and executed. That notebook then becomes an immutable historical record, containing all related artifacts — including source code, parameters, runtime config, execution logs, error messages, and so on. When troubleshooting failures, this offers a quick entry point for investigation, as all relevant information is colocated and the notebook can be launched for interactive debugging.
Notebook Infrastructure
Supporting these use cases at Netflix scale requires extensive supporting infrastructure. Let’s briefly introduce some of the projects we’ll be talking about.
nteract is a next-gen React-based UI for Jupyter notebooks. It provides a simple, intuitive interface and offers several improvements over the classic Jupyter UI, such as inline cell toolbars, drag and droppable cells, and a built-in data explorer.
Papermill is a library for parameterizing, executing, and analyzing Jupyter notebooks. With it, you can spawn multiple notebooks with different parameter sets and execute them concurrently. Papermill can also help collect and summarize metrics from a collection of notebooks.
Commuter is a lightweight, vertically-scalable service for viewing and sharing notebooks. It provides a Jupyter-compatible version of the contents API and makes it trivial to read notebooks stored locally or on Amazon S3. It also offers a directory explorer for finding and sharing notebooks.
Titus is a container management platform that provides scalable and reliable container execution and cloud-native integration with Amazon AWS. Titus was built internally at Netflix and is used in production to power Netflix streaming, recommendation, and content systems.
We’ll explore this infrastructure more deeply in future blog posts. For now, we’ll focus on three fundamental components: storage, compute, and interface.
Notebook Infrastructure at Netflix
Storage
The Netflix Data Platform relies on Amazon S3 and EFS for cloud storage, which notebooks treat as virtual filesystems. This means each user has a home directory on EFS, which contains a personal workspace for notebooks. This workspace is where we store any notebook created or uploaded by a user. This is also where all reading and writing activity occurs when a user launches a notebook interactively. We rely on a combination of [workspace + filename] to form the notebook’s namespace, e.g. /efs/users/kylek/notebooks/MySparkJob.ipynb. We use this namespace for viewing, sharing, and scheduling notebooks. This convention prevents collisions and makes it easy to identify both the user and the location of the notebook in the EFS volume.
We can rely on the workspace path to abstract away the complexity of cloud-based storage from users. For example, only the filename of a notebook is displayed in directory listings, e.g. MySparkJob.ipynb. This same file is accessible at ~/notebooks/MySparkJob.ipynb from a terminal.
Notebook storage vs. notebook access
When the user schedules a notebook, the scheduler copies the user’s notebook from EFS to a common directory on S3. The notebook on S3 becomes the source of truth for the scheduler, or source notebook. Each time the scheduler runs a notebook, it instantiates a new notebook from the source notebook. This new notebook is what actually executes and becomes an immutable record of that execution, containing the code, output, and logs from each cell. We refer to this as the output notebook.
Collaboration is fundamental to how we work at Netflix. It came as no surprise then when users started sharing notebook URLs. As this practice grew, we ran into frequent problems with accidental overwrites caused by multiple people concurrently accessing the same notebook . Our users wanted a way to share their active notebook in a read-only state. This led to the creation of commuter. Behind the scenes, commuter surfaces the Jupyter APIs for /files and /api/contents to list directories, view file contents, and access file metadata. This means users can safely view notebooks without affecting production jobs or live-running notebooks.
Compute
Managing compute resources is one of the most challenging parts of working with data. This is especially true at Netflix, where we employ a highly-scalable containerized architecture on AWS. All jobs on the Data Platform run on containers — including queries, pipelines, and notebooks. Naturally, we wanted to abstract away as much of this complexity as possible.
A container is provisioned when a user launches a notebook server. We provide reasonable defaults for container resources, which works for ~87.3% of execution patterns. When that’s not enough, users can request more resources using a simple interface.
Users can select as much or as little compute + memory as they need
We also provide a unified execution environment with a prepared container image. The image has common libraries and an array of default kernels preinstalled. Not everything in the image is static — our kernels pull the most recent versions of Spark and the latest cluster configurations for our platform. This reduces the friction and setup time for new notebooks and generally keeps us to a single execution environment.
Under the hood we’re managing the orchestration and environments with Titus, our Docker container management service. We further wrap that service by managing the user’s particular server configuration and image. The image also includes user security groups and roles, as well as common environment variables for identity within included libraries. This means our users can spend less time on infrastructure and more time on data.
Interface
Earlier we described our vision for notebooks to become the tool of choice for working with data. But this presents an interesting challenge: how can a single interface support all users? We don’t fully know the answer yet, but we have some ideas.
We know we want to lean into simplicity. This means an intuitive UI with a minimalistic aesthetic, and it also requires a thoughtful UX that makes it easy to do the hard things. This philosophy aligns well with the goals of nteract, a React-based frontend for Jupyter notebooks. It emphasizes simplicity and composability as core design principles, which makes it an ideal building block for the work we want to do.
One of the most frequent complaints we heard from users is the lack of native data visualization across language boundaries, especially for non-Python languages. nteract’s Data Explorer is a good example of how we can make the hard things simpler by providing a language-agnostic way to explore data quickly.
You can see Data Explorer in action in this sample notebook on MyBinder. (please note: it may take a minute to load)
Visualizing the World Happiness Report dataset with nteract’s Data Explorer
We’re also introducing native support for parametrization, which makes it easier to schedule notebooks and create reusable templates.
Native support for parameterized notebooks in nteract
Although notebooks are already offering a lot of value at Netflix, we’ve just begun. We know we need to make investments in both the frontend and backend to improve the overall notebook experience. Our work over the next 12 months is focused on improving reliability, visibility, and collaboration. Context is paramount for users, which is why we’re increasing visibility into cluster status, kernel state, job history, and more. We’re also working on automatic version control, native in-app scheduling, better support for visualizing Spark DataFrames, and greater stability for our Scala kernel. We’ll go into more detail on this work in a future blog post.
Open Source Projects
Netflix has long been a proponent of open source. We value the energy, open standards, and exchange of ideas that emerge from open source collaborations. Many of the applications we developed for the Netflix Data Platform have already been open sourced through Netflix OSS. We are also intentional about not creating one-off solutions or succumbing to “Not Invented Here” mentality. Whenever possible, we leverage and contribute to existing open source projects, such as Spark, Jupyter, and pandas.
The infrastructure we’ve described relies heavily on the Project Jupyter ecosystem, but there are some places where we diverge. Most notably, we have chosen nteract as the notebook UI for Netflix. We made this decision for many reasons, including alignment with our technology stack and design philosophies. As we push the limits of what a notebook can do, we will likely create new tools, libraries, and services. These projects will also be open sourced as part of the nteract ecosystem.
We recognize that what makes sense for Netflix does not necessarily make sense for everyone. We have designed these projects with modularity in mind. This makes it possible to pick and choose only the components that make sense for your environment, e.g. Papermill, without requiring a commitment to the entire ecosystem.
What’s Next
As a platform team, our responsibility is to enable Netflixers to do amazing things with data. Notebooks are already having a dramatic impact at Netflix. With the significant investments we’re making in this space, we’re excited to see this impact grow. If you’d like to be a part of it, check out our job openings.
Phew! Thanks for sticking with us through this long post. But we’ve just scratched the surface of what we’re doing with notebooks. In our next post, we’ll explore more deeply the architecture behind notebook scheduling. Until then, here are some ways to learn more about what Netflix is doing with data and how we’re doing it:
We’re also thrilled to sponsor this year’s JupyterCon. If you’re attending, check out one of the 5 talks by our engineers, or swing by our booth to talk about Jupyter, nteract, or data with us.
At Netflix we’ve put substantial effort into adopting notebooks as an integrated development platform. The idea started as a discussion of what development and collaboration interfaces might look like in the future. It evolved into a strategic bet on notebooks, both as an interactive UI and as the unifying foundation of our workflow scheduler. We’ve made significant strides towards this over the past year, and we’re currently in the process of migrating all 10,000 of the scheduled jobs running on the Netflix Data Platform to use notebook-based execution. When we’re done, more than 150,000 Genie jobs will be running through notebooks on our platform every single day.
Example of a parameterized ETL script in Jupyter Notebooks
Origin Story
When thinking about the future of analytics tooling, we initially asked ourselves a few basic questions:
What interface will a data scientist use to communicate the results of a statistical analysis to the business?
How will a data engineer write code that a reliability engineer can help ensure runs every hour?
How will a machine learning engineer encapsulate a model iteration their colleagues can reuse?
We also wondered: is there a single tool that can support all of these scenarios?
Contemplations of the future
One tool that showed promise was the Jupyter notebook. Notebooks were already used at Netflix for data science but were increasingly being used for other types of workloads too. With its flexible nature and high extensibility, plus its large and vibrant open source community, notebooks was a compelling option. So, we took a deeper look at how we might use it as a common interface for our users.
Notebooks are, in essence, managed JSON documents with a simple interface to execute code within. They’re good at expressing iterative units of work via cells, which facilitate reporting and execution isolation with ease. Plus, with different kernels, notebooks can support a wide range of languages and execution patterns. These attributes mean that we can expose any arbitrary level of complexity for advanced users while presenting a more easily followed narrative for consumers — all within a single document. We talk about these attributes and their supporting services more in our previous post. If you haven’t read it yet, it’s a good introduction to the work we’re doing on notebooks, including our motivations and other use cases.
We knew that any tooling we chose we would need the ability to schedule our workloads. As the potential of Jupyter notebooks became increasingly clear, we began to look at what it would take to schedule a notebook. The properties of a notebook, while excellent for interactive work, do not readily lend to scheduled execution. If you’re already familiar with notebooks — both their strengths and weaknesses — you may even think we’re a little crazy for moving all of our etl workloads to notebooks.
Notebook Woes to Wins
On the surface, notebooks pose a lot of challenges: they’re frequently changed, their cell outputs need not match the code, they’re difficult to test, and there’s no easy way to dynamically configure their execution. Furthermore, you need a notebook server to run them, which creates architectural dependencies to facilitate execution. These issues caused some initial push-back internally at the idea. But that has changed as we’ve brought in new tools to our notebook ecosystem.
The biggest game-changer for us is Papermill. Papermill is an nteract library built for configurable and reliable execution of notebooks with production ecosystems in mind. What Papermill does is rather simple. It take a notebook path and some parameter inputs, then executes the requested notebook with the rendered input. As each cell executes, it saves the resulting artifact to an isolated output notebook.
Overview of nteract’s Papermill library
Papermill enables a paradigm change in how you work with notebook documents. Since Papermill doesn’t modify the source notebook, we get a functional property added to our definition of work — something which is normally missing in the notebook space. Our inputs, a notebook JSON document and our input parameters, are treated as immutable records for execution that produce an immutable output document. That single output document provides the executed code, the outputs and logs from each code cell, and a repeatable template which can be easily rerun at any point in the future.
Another feature of Papermill is its ability to read or write from many places. This enables us to store our output notebook somewhere with high durability and easy access in order to provide a reliable pipeline. Today we default to storing our output notebooks to an s3 bucket managed by Commuter, another nteract project which provides a read-only display of notebooks.
Output notebooks can thus become isolated records on whichever system best supports our users. This makes analyzing jobs or related work as easy as linking to a service or S3 prefix. Users can take those links and use them to debug issues, check on outcomes, and create new templates without impacting the original workflows.
Additionally, since Papermill controls its own runtime processes, we don’t need any notebook server or other infrastructure to execute against notebook kernels. This eliminates some of the complexities that come with hosted notebook services as we’re executing in a simpler context.
A deeper look at the Papermill library
To further improve notebook reliability, we push our notebooks into git and only promote them to production services after we run tests against those notebooks using Papermill. If a notebook becomes too complex to easily test, we have the local repository into which we can consolidate code in a more traditional package. This allows us to gain the benefits of normal CI tooling in promoting notebooks as traditional code, but still allow us to explore and iterate with notebooks as an integration tool.
Our notebooks thus became versioned, pushed as immutable records to a reliable data store before and after execution, tested before they’re made available, and made parameterizable for specialization at runtime. The user-friendly-but-unreliable notebook format is now made reliable for our data pipelines, and we’ve gained a key improvement over a non-notebook execution pattern: our input and outputs are complete documents, wholly executable and shareable in the same interface.
Scheduling Notebooks
Even with a platform supporting the testing, versioning, and presentation of notebooks we were still missing a key component to enable users to run work on a periodic basis with triggered executions — or more concisely, we needed a scheduling layer. Executing a notebook through a web interface is great for visual and reactive feedback for users, but once you have something working you need a tool to do that execution on your behalf.
The execution side of this equation is made easy with Papermill. We can compute runtime parameters and inject them into a notebook, run the notebook, and store the outcomes to our data warehouse. This architecture decouples parameterized notebooks from scheduling, providing flexibility in choosing a scheduler. Thus just about any cron string and/or event consuming tool can enable running the work we’ve setup so far.
Running scheduled notebooks on Docker containers
This means that so long as a few basic capabilities are present, scheduling notebooks is easy. Instead, you’ll want to spend effort here on choosing the secondary attributes of the scheduler that you care most about. You may want to reuse a tool already familiar to your team, or make a choice to satisfy other operational needs. If you don’t have a preferred scheduler or haven’t used one before, Airflow is an open source tool that can serve this role well.
In our case, the secondary attributes we cared about were:
Trigger or wait-for capabilities for external events
Ability to launch inside a controlled execution environment (e.g. Docker)
Capturing and exposing metrics on executions and failures
Concurrency controls
Configurability of dynamic retries
Ability for reliability teams to intercede on behalf of users
These requirements left us with a handful of potential options to consider, including both open and closed source solutions. After thoroughly exploring our options, we chose a scheduler developed at Netflix called Meson. Meson is a general purpose workflow orchestration and scheduling framework for executing ML pipelines across heterogeneous systems. One of the major factors for us choosing Meson is its deep support for Netflix’s existing cloud-based infrastructure, including our data platform.
User Workflow
With a scheduler in place, how would this to look to a developer? Let’s explore a hypothetical data workflow. Suppose we want to aggregate video plays by device type to understand which devices our members use to watch content. Because we’re global, we need to split our aggregates by region so we can understand the most popular devices in each part of the world. And, once the results are ready each day, we want to push the updated report to our analysts.
To start, we’ll need a schedule for our workflow. Let’s say daily at 2 AM. Most schedulers accept crontab as a schedule trigger, so a single 0 2 * * * string satisfies this requirement.
Next, we need to break our work into logical units of work. We’ll want to collect our data, aggregate it, and report back to the user the results. To express this work we’ll define a DAG with each individual job represented as a node in the graph, and each edge represents the next job to run upon success.
Example DAG of a hypothetical workflow
In this scenario, we would need four notebooks. One to collect our input data. One to enhance our raw data with geographical information. One to be parameterized for each region. And one to push our results to a report. Our aggregate notebook, for example, might have a parameterized execution such as:
Example of a parameterized Jupyter notebook
We have a few lines of code to execute a simple SQL statement. You can see that in cell [4] we have our injected parameters from Papermill overwriting the default region_code. The run_date is already what we want, so we’ll keep the default instead of overwriting it.
The scheduler then executes a simple command to run the notebook.
Done! Pretty easy, isn’t it? Now, this is a contrived example and may not reflect how our data engineers would actually go about this work, but it does help demonstrate how everything fits together in a workflow.
Self Service Debugging
Another important aspect to consider when bringing new technologies to a platform is the ability to debug and support its users. With notebooks, this is probably the most beneficial aspect of our scheduler system.
Let’s dig into how we would deal with a failure. Say something went wrong in our example notebook from earlier. How might we debug and fix the issue? The first place we’d want to look is the notebook output. It will have a stack trace, and ultimately any output information related to an error.
Failure message within a cell
Here we see that our job couldn’t find the ‘genie.typo’ hostname. That’s probably not a user input error, so we’ll likely need to change the template to have the correct hostname. In a traditional scheduler situation, you’d need to either create a mock of the job execution environment or try making changes and resubmitting a similar job. Here instead we simply take the output notebook with our exact failed runtime parameterizations and load it into a notebook server.
With a few iterations and looking at our job library methods, we can quickly find a fix for the failure.
Successfully re-running the updated notebook
Now that it’s fixed, this template can be pushed to the source notebook path. Any future executions, including retrying the failed job, will pick up and run the updated template.
Integrating Notebooks
At Netflix we’ve adopted notebooks as an integration tool, not as a library replacement. This means we needed to adopt good integration testing to ensure our notebooks execute smoothly and don’t frequently run into bugs. Since we already have a pattern for parameterizing our execution templates, we repeat these interactions with dummy inputs as a test of linear code paths.
papermill s3://etlbucket/jobs/templates/vid_agg.ipynb s3://etlbucket/jobs/tests/.ipynb -p region_code luna -p run_date 2017_01_01
Running integration tests with Papermill
What this means is that we’re not using notebooks as code libraries and consequently aren’t pressing for unit level tests on our notebooks, as those should be encapsulated by the underlying libraries. Instead, we promote guiding principles for notebook development:
Low Branching Factor: Keep your notebooks fairly linear. If you have many conditionals or potential execution paths, it becomes hard to ensure end-to-end tests are covering the desired use cases well.
Library Functions in Libraries: If you do end up with complex functions which you might reuse or refactor independently, these are good candidates for a coding library rather than in a notebook. Providing your notebooks in git repositories means you can position shared unit-tested code in that same repository as your notebooks, rather than trying to unit test complex notebooks.
Short and Simple is Better: A notebook which generates lots of useful outputs and visuals with a few simple cells is better than a ten page manual. This makes your notebooks more shareable, understandable, and maintainable.
When followed, these guidelines make it easy for us to guide and support our users across a wide spectrum of use-cases and underlying technologies.
Next Steps
With the choices and technologies outlined thus far, we’ve been able to start building the shared experience we described at the beginning of this post. Adoption internally at Netflix has been growing quickly this year, and we’re ahead of schedule to completely replacing several of our pre-existing ETL and reporting patterns.
But we’re far from done. We still have work we want to do to improve the development experience and ease of adoption. Namely, we want better code review patterns for notebooks using tools like nbdime, more integration of CI and platform tools to notebooks, and easier ways to schedule and share notebooks. These, and many more, useful improvements will help make notebooks a common and easy entry-point for cross-functional development at Netflix. If you’d like to help us with these efforts, our team is currently hiring for multiple roles.
If you’re curious to hear more, you can catch us at JupyterCon in NYC this week, where several of us are speaking about Jupyter notebooks, scheduling, and new open source libraries.
You can also stay up to date with nteract via their mailing list and blog!
This post is part two in a series on notebooks at Netflix we’ll be releasing over the coming weeks. You can follow us on Medium for more from Netflix and check out the currently released articles below:
In the first part of this series of blogs, we described our philosophy, motivations, and approach to blending ad technology into our marketing. In addition, we laid out some of the engineering undertakings to solve creative development and localization at scale.
In this Part-2, we describe the process of scaling advertising at Netflix through ad assembly and personalization on the various ad platforms that we advertise in.
The Problem Surface
Our world-class marketing team has the unique task of showcasing our growing slate of Original Movies and TV Shows, and the unique stories behind every one of them. Their job is not just about promoting awareness of the content we produce, but an even harder one — of tailoring the right content, with the right message to qualified non-members (acquisition marketing) and members — collectively, billions of users who are reached by our online advertising. These ads will have to reach users on the internet on a variety of websites and publishers, on Facebook, Youtube and other ad platforms.
Imagine if you had to launch the digital marketing campaign for the next big blockbuster movie or must-watch TV show. You will need to create ads for a variety of creative concepts, A/B tests, ad formats and localizations, then QC (quality control) all of them for technical and content errors. Having taken those variations into consideration, you’ll need to traffic them to the respective platforms that those ads are going to be delivered from. Now, imagine launching multiples titles daily while still ensuring that every single one of these ads reaches the exact person that they are meant to speak to. Finally, you need to continue to manage your portfolio of ads after the campaign launches in order to ensure that they are kept up to date (for eg. music licensing rights and expirations) and continue to support phases that roll in post-launch.
There are three broad areas that the problem can be broken down into :
Ad Assembly: A scalable way of producing ads and building workflow automation
Creative QC: Set of tools and services that make it possible to easily QC thousands of ad units for functional and semantic correctness
Ad Catalog Management: Capabilities that make it possible for managing scale campaigns easily — ML based automation
What is Ad Assembly?
Overall, if you looked at the problem from a purely analytical perspective, we need to find a way to efficiently automate and manage the scale resulting from textbook combinatorial explosion.
Total Ad Cardinality ≈
Titles in Catalog x Ad Platforms x Concepts x Formats x A/B Tests x Localizations
Our approach of handling the combinatorics to catch it at the head and to create marketing platforms where our ad operations, the primary users of our product, can concisely express the gamut of variations with the least amount of redundant information.
CREATIVE VARIATIONS IN VIDEO BASED SOCIAL ADS
Consider the ads below, which differ along a number of different dimensions that are highlighted.
CREATIVE VARIATIONS IN DISPLAY ADS
If you were to simply vary just the unique localizations for this ad for all the markets that we advertise in, that would result in ~30 variations. In a world with static ad creation, that means that 30 unique ad files will be produced by marketing and then trafficked. In addition to the higher effort, any change that needs to address all the units would then have to be introduced into each of them separately and then QC-ed all over again. Even a minor modification in just a single creative expression, such as an asset change, would involve making modifications within the ad unit. Each variation would then need to go through the rest of the flow involving, QC and a creative update / re-trafficking.
Our solve for the above was to build a dynamic ad creation and configuration platform — our ad production partners build a single dynamic unit and then the associated data configuration is used to modify the behavior of the ad units contextually. Secondly, by providing tools where marketers have to express just the variations and automatically inherit what doesn’t change, we significantly reduce the surface area of data that needs to be defined and managed.
If you look at the localized versions below, they reused the same fundamental building blocks but got expressed as different creatives based on nothing but configuration.
EASY CONFIGURATION OF LOCALIZATIONS
This makes it possible to go from 1 => 30 localizations in a matter of minutes instead of hours or even days for every single ad unit!
We are also able to make the process more seamless by building integrations with a number of useful services to speed up the ad assembly process. For example, we have integrated features like support for maturity ratings, transcoding and compressing video assets or pulling in artwork from our product catalog. Taken together, these conveniences dramatically decrease the level of time effort needed to run campaigns with extremely large footprints.
Creative QC
One major aspect of quality control to ensure that the ad is going to render correctly and free from any technical or visual errors — we call this “functional QC”. Given the breadth of differences amongst various ad types and the kinds of possible issues, here are some of the top-line approaches that we have pursued to improve the state of creative QC.
First, we have tools that plug in sensible values throughout the ad assembly process and reduce the likelihood of errors.
Then, we minimize the total volume of QC issues encountered by adding validations and correctness checks throughout the ad assembly process. For eg. we surface a warning when character limits on Facebook video ads are exceeded.
WARNINGS DURING AD ASSEMBLY
Secondly, we run suites of automated tests that help identify if there are any technical issues that are present in the ad unit that may negatively impact either the functionality or cause negative side-effects to the user-experience.
SAMPLE AUTOMATED SCAN FROM A DISPLAY AD
Most recently, we’ve started leveraging machine vision to handle some QC tasks. For eg. depending on where an ad needs to be delivered, there might have to be the need to add specific rating images. To verify that the right rating image was applied in the video creation process, we now use an image detection algorithm developed by our Cloud Media Systems team. As the volume of AV centric creatives continues to scale and increase over time, we will be adding more such solutions to our overall workflow.
SAMPLE RATING IMAGE QC-ED WITH COMPUTER VISION
In addition to the functional correctness, we also care a whole lot about semantic QC — i.e for our marketing users to determine if the ads are being true to their creative goals and representing the tone and voice of the content and of the Netflix brand accurately.
One of the core tenets around which our ad platform is built is immediate updates with live renderings across the board. This, coupled with the fact that our users can identify and make pinpointed updates with broad implications easily, allows them to fix issues as fast as they can find them. Our users are also able to collaborate on creative feedback, reviews much more efficiently by sharing tearsheets as needed. A tearsheet is a preview of the final ad after it has been locked and is used to get final clearance ahead of launch.
Given how important this process is to the overall health and success of our advertising campaigns, we’re investing heavily on QC automation infrastructure. We’re also actively working on enabling sophisticated task management, status tracking and notification workflows that help us scale to even higher orders of magnitude in a sustainable way.
Ad Catalog Management
Once the ads are prepared, instead of directly trafficking them as such, we decouple the ad creation, assembly from ad trafficking with a “catalog” layer.
A catalog picks the sets of ads to run with based on the intent of the campaign — Is it meant for building title awareness or for acquisition marketing? Are we running a campaign for a single movie or show or does it highlight multiple titles or is it a brand-centric asset? Is this a pre-launch campaign or a post-launch campaign?
Once a definition is assigned by the user, an automated catalog handles the following concerns amongst other things :
Uses aggregate first party data and machine-learnt models, user configuration, ad performance data etc. to manage the creatives it delivers
Automatically makes requests for production of ads that are needed but not available already
Reacts to changing asset availability, recommendation data, blacklisting etc.
Simplifies user workflows — management of pre-launch and post-launch phases of the campaign, scheduling content refreshes etc.
Collects metrics and track asset usage and efficiency
The catalog is hence a very powerful tool as it optimizes itself and hence the campaign it’s supporting — in effect, it turns our first party data into an “intelligence-layer”.
Personalization and A/B Tests
All of this can add to a sum greater than its parts — for eg. using this technology, we can now run a Global Scale Vehicle — an always-on / evergreen, auto-optimizing campaigns powered by content performance data and ad performance data. Along with automatic budget allocation algorithms (we’ll discuss it in the next blog post in this series), this tames the operational complexity very effectively. As a result, our marketing users get to focus to building amazing creatives and formulating A/B tests and market plans on their end, and our automated catalogs help to deliver the right creative to the right place in a hands off fashion — automating the ad selection and personalization.
In order to understand why this is a game changer, let’s reflect on the previous approach — every title that needed to be launched had to involve planning on budgeting, targeting, which regions to support any title in, how long to run and to what spend levels, etc.
This was a phenomenally hard task in the face of our ever increasing content library, breadth and nuances of marketing to nearly all countries of the world and the number of platforms and formats needing support to reach our addressable audience. Secondly, it was challenging to react fast enough to unexpected variations in creative performance all while also focusing on upcoming campaigns and launches.
In true, Netflix fashion, we arrived at this model through a series of A/B tests — originally, we ran several tests learning that an always-on ad catalog with personalized delivery outperformed our previous tentpole launch approach. We then ran many more follow-ups to determine how to do it well on different platforms. As one would imagine, this is fundamentally a process of continuous learning and we’re pleasantly surprised to find huge, successive improvements on our optimization metrics as we’ve continued to run growing number of marketing A/B tests around the world.
Service Architecture
We enable this technology using a number of Java and Groovy based microservices that tap into various NoSQL stores such as Cassandra and Elasticsearch and use Kafka, Hermes to glue the different parts by either transporting data or triggering events that result in dockerized micro-applications getting invoked on Titus.
We use RxJava fairly heavily and the ad server which handles real-time requests for servicing display and VAST videos uses RxNetty as it’s application framework and it offers customizability while bringing minimal features and associated overheads. For the ads middle tier application server, we use a Tomcat / Jersey / Guice powered service as it offers way more features and easy integrations for it’s concerns such as easy authentication and authorization, out-of-the-box support for Netflix’s cloud ecosystem as we lack of strict latency and throughput constraints.
Future
Although we’ve had the opportunity to build a lot of technology in the last few years, the practical reality is that our work is far from done.
We’ve had a high degree of progress on some ad platforms, we’re barely getting started on others and there’s some we aren’t even ready to think of, just yet. On some, we’ve hit the entirety of ad creation, assembly and management and QC, on others, we’ve not even scratched the full surface of just plain assembly.
Automation and machine learning have gotten us pretty far — but our organizational appetite for doing more and doing better is far outpacing the speed with which can build these systems. With every A/B test having us think of more avenues of exploration and in using data to power analysis and prediction in various aspects of our ad workflows, we’ve got a lot of interesting challenges to look forward to.
Closing
In summary, we’ve discussed how we build unique ad technology that helps us add both scale and add intelligence into advertising efforts. Some of the details themselves are worth follow-up posts on and we’ll be publishing them in the future.
To further our marketing technology journey, we’ll have the next blog shortly that moves the story forward towards how we support marketing analytics from a variety of platforms and make it possible to compare proverbial apples and oranges and use it to optimize campaign spend.
If you’re interested in joining us in working on some of these opportunities within Netflix’s Marketing Tech, we’re hiring! :)