“Creating a good API is hard.” — anyone who has created an API used by others
As with any API, wrapping your data stream in a Rx observable requires consideration for reasonable error handling and intuitive behavior. The following guidelines are intended to help developers create consistent and intuitive API.
Since we frequently create Rx Observables in our Android app, we needed a common understanding of when to use onNext() and when to use onError() to make the API more consistent for subscribers. The divergent understanding is partially because the name “onError” is a bit misleading. The item emitted by onError() is not a simple error, but a throwable that can cause significant damage if not caught. Our app has a global handler that prevents it from crashing outright, but an uncaught exception can still leave parts of the app in an unpredictable state.
TL;DR — Prefer onNext() and only use onError() for exceptional cases.
Considerations for onNext / onError
The following are points to consider when determining whether to use onNext() versus onError().
The Contract
First here are the definitions of the two from the ReactiveX contract page:
OnNext conveys an item that is emitted by the Observable to the observer
OnError indicates that the Observable has terminated with a specified error condition and that it will be emitting no further items
As pointed out in the above definition, a subscription is automatically disposed after onError(), just like after onComplete(). Because of this, onError() should only be used to signal a fatal error and never to signal an intermittent problem where more data is expected to stream through the subscription after the error.
Treat it like an Exception
Limit using onError() for exceptional circumstances when you’d also consider throwing an Error or Exception. The reasoning is that the onError() parameter is a Throwable. An example for differentiating: a database query returning zero results is typically not an exception. The database returning zero results because it was forcibly closed (or otherwise put in a state that cancels the running query) would be an exceptional condition.
Be Consistent
Do not make your observable emit a mix of both deterministic and non-deterministic errors. Something is deterministic if the same input always result in the same output, such as dividing by 0 will fail every time. Something is non-deterministic if the same inputs may result in different outputs, such as a network request which may timeout or may return results before the timeout. Rx has convenience methods built around error handling, such as retry() (and our retryWithBackoff()). The primary use of retry() is to automatically re-subscribe an observable that has non-deterministic errors. When an observable mixes the two types of errors, it makes retrying less obvious since retrying a deterministic failures doesn’t make sense — or is wasteful since the retry is guaranteed to fail. (Two notes: 1. retry can also be used in certain deterministic cases like user login attempts, where the failure is caused by incorrectly entering credentials. 2. For mixed errors, retryWhen() could be used to only retry the non-deterministic errors.) If you find your observable needs to emit both types of errors, consider whether there is an appropriate separation of concerns. It may be that the observable can be split into several observables that each have a more targeted purpose.
Be Consistent with Underlying APIs
When wrapping an asynchronous API in Rx, consider maintaining consistency with the underlying API’s error handling. For example, if you are wrapping a touch event system that treats moving off the device’s touchscreen as an exception and terminates the touch session, then it may make sense to emit that error via onError(). On the other hand, if it treats moving off the touchscreen as a data event and allows the user to drag their finger back onto the screen, it makes sense to emit it via onNext().
Avoid Business Logic
Related to the previous point. Avoid adding business logic that interprets the data and converts it into errors. The code that the observable is wrapping should have the appropriate logic to perform these conversions. In the rare case that it does not, consider adding an abstraction layer that encapsulates this logic (for both normal and error cases) rather than building it into the observable.
Passing Details in onError()
If your code is going to use onError(), remember that the throwable it emits should include appropriate data for the subscriber to understand what went wrong and how to handle it.
For example, our Falcor response handler uses a FalcorError class that includes the Status from the callback. Repositories could also throw an extension of this class, if extra details need to be included.
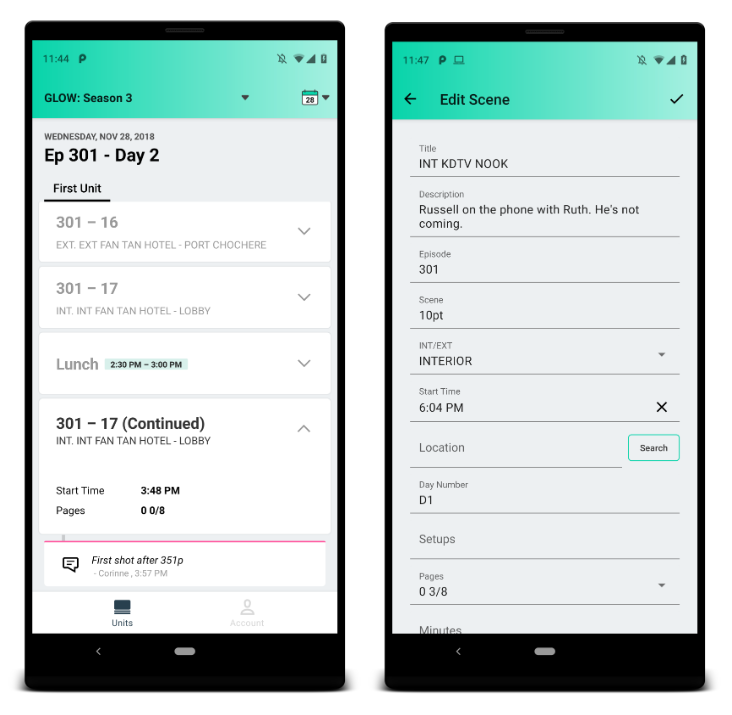
Our very first mobile app is called Prodicle and was built for Android & iOS using the same reactive architecture in both platforms, which allowed us to build 2 apps from scratch in 3 months with 4 software engineers.
The app helps production crews organize their shooting days through shooting milestones and keeps everyone in a production informed about what is currently happening.
We’ve been experimenting with an idea to use reactive components on Android for the last two years. While there are some frameworks that implement this, we wanted to stay very close to the Android native framework. It was extremely important to the team that we did not completely change the way our engineers write Android code.
We believe reactive components are the key foundation to achieve composable UIs that are scalable, reusable, unit testable and AB test friendly. Composable UIs contribute to fast engineering velocity and produce less side effect bugs.
Our current player UI in the Netflix Android app is using our first iteration of this componentization architecture. We took the opportunity with building Prodicle to improve upon what we learned with the Player UI, and build the app from scratch using Redux, Components, and 100% Kotlin.
Overall Architecture
Fragments & Activities
— Fragment is not your view.
Having large Fragments or Activities causes all sorts of problems, it makes the code hard to read, maintain, and extend. Keeping them small helps with code encapsulation and better separation of concerns — the presentation logic should be inside a component or a class that represents a view and not in the Fragment.
This is how a clean Fragment looks in our app, there is no business logic. During the onViewCreated we pass pre-inflated view containers and the global redux store’s dispatch function.
UI Components
Components are responsible for owning their own XML layout and inflating themselves into a container. They implement a single render(state: ComponentState) interface and have their state defined by a Kotlin data class.
A component’s render method is a pure function that can easily be tested by creating a permutation of possible states variances.
Dispatch functions are the way components fire actions to change app state, make network requests, communicate with other components, etc.
A component defines its own state as a data class in the top of the file. That’s how its render() function is going to be invoked by the render loop.
It receives a ViewGroup container that will be used to inflate the component’s own layout file, R.layout.list_header in this example.
All the Android views are instantiated using a lazy approach and the render function is the one that will set all the values in the views.
Layout
All of these components are independent by design, which means they do not know anything about each other, but somehow we need to layout our components within our screens. The architecture is very flexible and provides different ways of achieving it:
Self Inflation into a Container: A Component receives a ViewGroup as a container in the constructor, it inflates itself using Layout Inflater. Useful when the screen has a skeleton of containers or is a Linear Layout.
Pre inflated views. Component accepts a View in its constructor, no need to inflate it. This is used when the layout is owned by the screen in a single XML.
Self Inflation into a Constraint Layout: Components inflate themselves into a Constraint Layout available in its constructor, it exposes a getMainViewId to be used by the parent to set constraints programmatically.
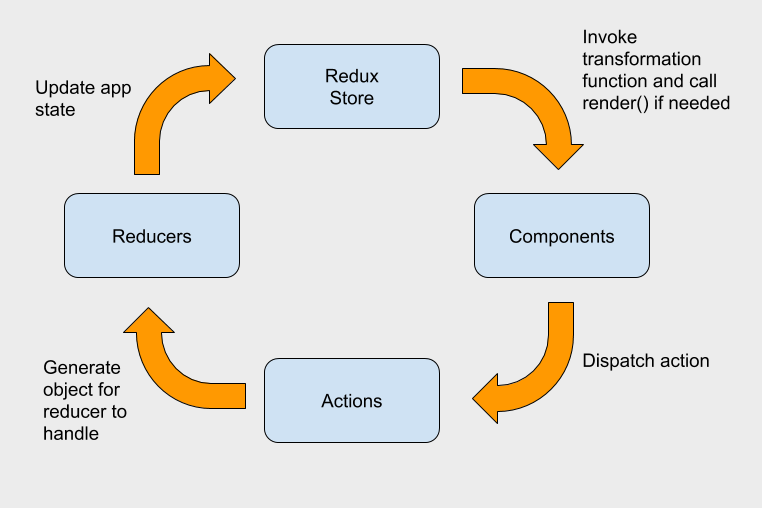
Redux
Redux provides an event driven unidirectional data flow architecture through a global and centralized application state that can only be mutated by Actions followed by Reducers. When the app state changes it cascades down to all the subscribed components.
Having a centralized app state makes disk persistence very simple using serialization. It also provides the ability to rewind actions that have affected the state for free. After persisting the current state to the disk the next app launch will put the user in exactly the same state they were before. This removes the requirement for all the boilerplate associated with Android’s onSaveInstanceState() and onRestoreInstanceState().
The Android FragmentManager has been abstracted away in favor of Redux managed navigation. Actions are fired to Push, Pop, and Set the current route. Another Component, NavigationComponent listens to changes to the backStack and handles the creation of new Screens.
The Render Loop
Render Loop is the mechanism which loops through all the components and invokes component.render() if it is needed.
Components need to subscribe to changes in the App State to have their render() called. For optimization purposes, they can specify a transformation function containing the portion of the App State they care about — using selectWithSkipRepeats prevents unnecessary render calls if a part of the state changes that the component does not care about.
The ComponentManager is responsible for subscribing and unsubscribing Components. It extends Android ViewModel to persist state on configuration change, and has a 1:1 association with Screens (Fragments). It is lifecycle aware and unsubscribes all the components when onDestroy is called.
Below is our fragment with its subscriptions and transformation functions:
ComponentManager code is below:
Recycler Views
Components should be flexible enough to work inside and outside of a list. To work together with Android’s recyclerView implementation we’ve created a UIComponent and UIComponentForList, the only difference is the second extends a ViewHolder and does not subscribe directly to the Redux Store.
Here is how all the pieces fit together.
Fragment:
The Fragment initializes a MilestoneListComponent subscribing it to the Store and implements its transformation function that will define how the global state is translated to the component state.
List Component:
A List Component uses a custom adapter that supports multiple component types, provides async diff in the background thread through adapter.update() interface and invokes item components render() function during onBind() of the list item.
Item List Component:
Item List Components can be used outside of a list, they look like any other component except for the fact that UIComponentForList extends Android’s ViewHolder class. As any other component it implements the render function based on a state data class it defines.
Unit Tests
Unit tests on Android are generally hard to implement and slow to run. Somehow we need to mock all the dependencies — Activities, Context, Lifecycle, etc in order to start to test the code.
Considering our components render methods are pure functions we can easily test it by making up states without any additional dependencies.
In this unit test example we initialize a UI Component inside the before() and for every test we directly invoke the render() function with a state that we define. There is no need for activity initialization or any other dependency.
Conclusion & Next Steps
The first version of our app using this architecture was released a couple months ago and we are very happy with the results we’ve achieved so far. It has proven to be composable, reusable and testable — currently we have 60% unit test coverage.
Using a common architecture approach allows us to move very fast by having one platform implement a feature first and the other one follow. Once the data layer, business logic and component structure is figured out it becomes very easy for the following platform to implement the same feature by translating the code from Kotlin to Swift or vice versa.
To fully embrace this architecture we’ve had to think a bit outside of the platform’s provided paradigms. The goal is not to fight the platform, but instead to smooth out some rough edges.
We’ve all had noisy neighbors at one point in our life. Whether it’s at a cafe or through a wall of an apartment, it is always disruptive. The need for good manners in shared spaces turns out to be important not just for people, but for your Docker containers too.
When you’re running in the cloud your containers are in a shared space; in particular they share the CPU’s memory hierarchy of the host instance.
Because microprocessors are so fast, computer architecture design has evolved towards adding various levels of caching between compute units and the main memory, in order to hide the latency of bringing the bits to the brains. However, the key insight here is that these caches are partially shared among the CPUs, which means that perfect performance isolation of co-hosted containers is not possible. If the container running on the core next to your container suddenly decides to fetch a lot of data from the RAM, it will inevitably result in more cache misses for you (and hence a potential performance degradation).
Linux to the rescue?
Traditionally it has been the responsibility of the operating system’s task scheduler to mitigate this performance isolation problem. In Linux, the current mainstream solution is CFS (Completely Fair Scheduler). Its goal is to assign running processes to time slices of the CPU in a “fair” way.
CFS is widely used and therefore well tested and Linux machines around the world run with reasonable performance. So why mess with it? As it turns out, for the large majority of Netflix use cases, its performance is far from optimal. Titus is Netflix’s container platform. Every month, we run millions of containers on thousands of machines on Titus, serving hundreds of internal applications and customers. These applications range from critical low-latency services powering our customer-facing video streaming service, to batch jobs for encoding or machine learning. Maintaining performance isolation between these different applications is critical to ensuring a good experience for internal and external customers.
We were able to meaningfully improve both the predictability and performance of these containers by taking some of the CPU isolation responsibility away from the operating system and moving towards a data driven solution involving combinatorial optimization and machine learning.
The idea
CFS operates by very frequently (every few microseconds) applying a set of heuristics which encapsulate a general concept of best practices around CPU hardware use.
Instead, what if we reduced the frequency of interventions (to every few seconds) but made better data-driven decisions regarding the allocation of processes to compute resources in order to minimize collocation noise?
One traditional way of mitigating CFS performance issues is for application owners to manually cooperate through the use of core pinning or nice values. However, we can automatically make better global decisions by detecting collocation opportunities based on actual usage information. For example if we predict that container A is going to become very CPU intensive soon, then maybe we should run it on a different NUMA socket than container B which is very latency-sensitive. This avoids thrashing caches too much for B and evens out the pressure on the L3 caches of the machine.
Optimizing placements through combinatorial optimization
What the OS task scheduler is doing is essentially solving a resource allocation problem: I have X threads to run but only Y CPUs available, how do I allocate the threads to the CPUs to give the illusion of concurrency?
As an illustrative example, let’s consider a toy instance of 16 hyperthreads. It has 8 physical hyperthreaded cores, split on 2 NUMA sockets. Each hyperthread shares its L1 and L2 caches with its neighbor, and shares its L3 cache with the 7 other hyperthreads on the socket:
If we want to run container A on 4 threads and container B on 2 threads on this instance, we can look at what “bad” and “good” placement decisions look like:
The first placement is intuitively bad because we potentially create collocation noise between A and B on the first 2 cores through their L1/L2 caches, and on the socket through the L3 cache while leaving a whole socket empty. The second placement looks better as each CPU is given its own L1/L2 caches, and we make better use of the two L3 caches available.
Resource allocation problems can be efficiently solved through a branch of mathematics called combinatorial optimization, used for example for airline scheduling or logistics problems.
We formulate the problem as a Mixed Integer Program (MIP). Given a set of K containers each requesting a specific number of CPUs on an instance possessing d threads, the goal is to find a binary assignment matrix M of size (d, K) such that each container gets the number of CPUs it requested. The loss function and constraints contain various terms expressing a priori good placement decisions such as:
avoid spreading a container across multiple NUMA sockets (to avoid potentially slow cross-sockets memory accesses or page migrations)
don’t use hyper-threads unless you need to (to reduce L1/L2 thrashing)
try to even out pressure on the L3 caches (based on potential measurements of the container’s hardware usage)
don’t shuffle things too much between placement decisions
Given the low-latency and low-compute requirements of the system (we certainly don’t want to spend too many CPU cycles figuring out how containers should use CPU cycles!), can we actually make this work in practice?
Implementation
We decided to implement the strategy through Linux cgroups since they are fully supported by CFS, by modifying each container’s cpuset cgroup based on the desired mapping of containers to hyper-threads. In this way a user-space process defines a “fence” within which CFS operates for each container. In effect we remove the impact of CFS heuristics on performance isolation while retaining its core scheduling capabilities.
This user-space process is a Titus subsystem called titus-isolate which works as follows. On each instance, we define three events that trigger a placement optimization:
add: A new container was allocated by the Titus scheduler to this instance and needs to be run
remove: A running container just finished
rebalance: CPU usage may have changed in the containers so we should reevaluate our placement decisions
We periodically enqueue rebalance events when no other event has recently triggered a placement decision.
Every time a placement event is triggered, titus-isolate queries a remote optimization service (running as a Titus service, hence also isolating itself… turtles all the way down) which solves the container-to-threads placement problem.
This service then queries a local GBRT model (retrained every couple of hours on weeks of data collected from the whole Titus platform) predicting the P95 CPU usage of each container in the coming 10 minutes (conditional quantile regression). The model contains both contextual features (metadata associated with the container: who launched it, image, memory and network configuration, app name…) as well as time-series features extracted from the last hour of historical CPU usage of the container collected regularly by the host from the kernel CPU accounting controller.
The predictions are then fed into a MIP which is solved on the fly. We’re using cvxpy as a nice generic symbolic front-end to represent the problem which can then be fed into various open-source or proprietary MIP solver backends. Since MIPs are NP-hard, some care needs to be taken. We impose a hard time budget to the solver to drive the branch-and-cut strategy into a low-latency regime, with guardrails around the MIP gap to control overall quality of the solution found.
The service then returns the placement decision to the host, which executes it by modifying the cpusets of the containers.
For example, at any moment in time, an r4.16xlarge with 64 logical CPUs might look like this (the color scale represents CPU usage):
Results
The first version of the system led to surprisingly good results. We reduced overall runtime of batch jobs by multiple percent on average while most importantly reducing job runtime variance (a reasonable proxy for isolation), as illustrated below. Here we see a real-world batch job runtime distribution with and without improved isolation:
Notice how we mostly made the problem of long-running outliers disappear. The right-tail of unlucky noisy-neighbors runs is now gone.
For services, the gains were even more impressive. One specific Titus middleware service serving the Netflix streaming service saw a capacity reduction of 13% (a decrease of more than 1000 containers) needed at peak traffic to serve the same load with the required P99 latency SLA! We also noticed a sharp reduction of the CPU usage on the machines, since far less time was spent by the kernel in cache invalidation logic. Our containers are now more predictable, faster and the machine is less used! It’s not often that you can have your cake and eat it too.
Next Steps
We are excited with the strides made so far in this area. We are working on multiple fronts to extend the solution presented here.
We want to extend the system to support CPU oversubscription. Most of our users have challenges knowing how to properly size the numbers of CPUs their app needs. And in fact, this number varies during the lifetime of their containers. Since we already predict future CPU usage of the containers, we want to automatically detect and reclaim unused resources. For example, one could decide to auto-assign a specific container to a shared cgroup of underutilized CPUs, to better improve overall isolation and machine utilization, if we can detect the sensitivity threshold of our users along the various axes of the following graph.
We also want to leverage kernel PMC events to more directly optimize for minimal cache noise. One possible avenue is to use the Intel based bare metal instances recently introduced by Amazon that allow deep access to performance analysis tools. We could then feed this information directly into the optimization engine to move towards a more supervised learning approach. This would require a proper continuous randomization of the placements to collect unbiased counterfactuals, so we could build some sort of interference model (“what would be the performance of container A in the next minute, if I were to colocate one of its threads on the same core as container B, knowing that there’s also C running on the same socket right now?”).
Conclusion
If any of this piques your interest, reach out to us! We’re looking for ML engineers to help us push the boundary of containers performance and “machine learning for systems” and systems engineers for our core infrastructure and compute platform.
Netflix brings delightful customer experiences to homes on a variety of devices that continues to grow each day. The device ecosystem is rich with partners ranging from Silicon-on-Chip (SoC) manufacturers, Original Design Manufacturer (ODM) and Original Equipment Manufacturer (OEM) vendors.
Partners across the globe leverage Netflix device certification process on a continual basis to ensure that quality products and experiences are delivered to their customers. The certification process involves the verification of partner’s implementation of features provided by the Netflix SDK.
The Partner Device Ecosystem organization in Netflix is responsible for ensuring successful integration and testing of the Netflix application on all partner devices. Netflix engineers run a series of tests and benchmarks to validate the device across multiple dimensions including compatibility of the device with the Netflix SDK, device performance, audio-video playback quality, license handling, encryption and security. All this leads to a plethora of test cases, most of them automated, that need to be executed to validate the functionality of a device running Netflix.
Problem
With a collection of tests that, by nature, are time consuming to run and sometimes require manual intervention, we need to prioritize and schedule test executions in a way that will expedite detection of test failures. There are several problems efficient test scheduling could help us solve:
Quickly detect a regression in the integration of the Netflix SDK on a consumer electronic or MVPD (multichannel video programming distributor) device.
Detect a regression in a test case. Using the Netflix Reference Application and known good devices, ensure the test case continues to function and tests what is expected.
When code many test cases are dependent on has changed, choose the right test cases among thousands of affected tests to quickly validate the change before committing it and running extensive, and expensive, tests.
Choose the most promising subset of tests out of thousands of test cases available when running continuous integration against a device.
Recommend a set of test cases to execute against the device that would increase the probability of failing the device in real-time.
Solving the above problems could help Netflix and our Partners save time and money during the entire lifecycle of device design, build, test, and certification.
These problems could be solved in several different ways. In our quest to be objective, scientific, and inline with the Netflix philosophy of using data to drive solutions for intriguing problems, we proceeded by leveraging machine learning.
In the case of continuously testing a Netflix SDK integration on a new device, we usually lack relevant data for model training in the early phases of integration. In this situation training an agent is a great fit as it allows us to start with very little input data and let the agent explore and exploit the patterns it learns in the process of SDK integration and regression testing. The agent in reinforcement learning is an entity that performs a decision on what action to take considering the current state of the environment, and gets a reward based on the quality of the action.
Solution
We built a system called Lerner that consists of a set of microservices and a python library that allows scalable agent training and inference for test case scheduling. We also provide an API client in Python.
Lerner works in tandem with our continuous integration framework that executes on-device tests using the Netflix Test Studio platform. Tests are run on Netflix Reference Applications (running as containers on Titus), as well as on physical devices.
There were several motivations that led to building a custom solution:
We wanted to keep the APIs and integrations as simple as possible.
We needed a way to run agents and tie the runs to the internal infrastructure for analytics, reporting, and visualizations.
We wanted the to tool be available as a standalone library as well as scalable API service.
Lerner provides ability to setup any number of agents making it the first component in our re-usable reinforcement learning framework for device certification.
Lerner, as a web-service, relies on Amazon Web Services (AWS) and Netflix’s Open Source Software (OSS) tools. We use Spinnaker to deploy instances and host the API containers on Titus — which allows fast deployment times and rapid scalability. Lerner uses AWS services to store binary versions of the agents, agent configurations, and training data. To maintain the quality of Lerner APIs, we are using the server-less paradigm for Lerner’s own integration testing by utilizing AWS Lambda.
The agent training library is written in Python and supports versions 2.7, 3.5, 3.6, and 3.7. The library is available in the artifactory repository for easy installation. It can be used in Python notebooks — allowing for rapid experimentation in isolated environments without a need to perform API calls. The agent training library exposes different types of learning agents that utilize neural networks to approximate action.
The neural network (NN)-based agent uses a deep net with fully connected layers. The NN gets the state of a particular test case (the input) and outputs a continuous value, where a higher number means an earlier position in a test execution schedule. The inputs to the neural network include: general historical features such as the last N executions and several domain specific features that provide meta-information about a test case.
The Lerner APIs are split into three areas:
Storing execution results.
Getting recommendations based on the current state of the environment.
Assign reward to the agent based on the execution result and predicted recommendations.
A process of getting recommendations and rewarding the agent using APIs consists of 4 steps:
Out of all available test cases for a particular job — form a request that can be interpreted by Lerner. This involves aggregation of historical results and additional features.
Lerner returns a recommendation identified with a unique episode id.
A CI system can execute the recommendation and submit the execution results to Lerner based on the episode id.
Call an API to assign a reward based on the agent id and episode id.
Below is a diagram of the services and persistence layers that support the functionality of the Lerner API.
The self-service nature of the tool makes it easy for service owners to integrate with Lerner, create agents, ask agents for recommendations and reward them after execution results are available.
The metrics relevant to the training and recommendation process are reported to Atlas and visualized using Netflix’s Lumen. Users of the service can track the statistics specific to the agents they setup and deploy, which allows them to build their own dashboards.
We have identified some interesting patterns while doing online reinforcement learning.
The recommendation/execution reward cycle can happen without any prior training data.
We can bootstrap several CI jobs that would use agents with different reward functions, and gain additional insight based on agents performance. It could help us design and implement more targeted reward functions.
We can keep a small amount of historical data to train agents. The data can be truncated after each execution and offloaded to a long-term storage for further analysis.
Some of the downsides:
It might take time for an agent to stop exploring and start exploiting the accumulated experience.
As agents stored in a binary format in the database, an update of an agent from multiple jobs could cause a race condition in its state. Handling concurrency in the training process is cumbersome and requires trade offs. We achieved the desired state by relying on the locking mechanisms of the underlying persistence layer that stores and serves agent binaries.
Thus, we have the luxury of training as many agents as we want that could prioritize and recommend test cases based on their unique learning experiences.
Outcome
We are currently piloting the system and have live agents serving predictions for various CI runs. At the moment we run Lerner-based CIs in parallel with CIs that either execute test cases in random order or use simple heuristics as sorting test cases by time and execute everything that previously failed.
The system was built with simplicity and performance in mind, so the set of APIs are minimal. We developed client libraries that allow seamless, but opinionated, integration with Lerner.
We collect several metrics to evaluate the performance of a recommendation, with main metrics being time taken to first failure and time taken to complete a whole scheduled run.
Lerner-based recommendations are proving to be different and more insightful than random runs, as they allow us to fit a particular time budget and detect patterns such as cases that tend to fail together in a cluster, cases that haven’t been run in a long time, and so on.
The below graphs shows more or less an artificial case when a schedule of 100+ test cases would contain several flaky tests. The Y-axis represents how many minutes it took to complete the schedule or reach a first failed test case. In blue, we have random recommendations with no time budget constraints. In green you can see executions based on Lerner recommendations under a time constraint of 60 minutes. The green spikes represent Lerner exploring the environment, where the wiggly lines around 0 are the executions that failed quickly as Lerner was exploiting its policy.
Execution of schedules that were randomly generated. Y-axis represents time to finish execution or reach first failure.Execution of Lerner based schedules. You can see moments when Lerner was exploring the environment, and the wiggly lines represent when the schedule was generated based on exploiting existing knowledge.
Next Steps
The next phases of the project will focus on:
Reward functions that are aware of a comprehensive domain context, such as assigning appropriate rewards to states where infrastructure is fragile and test case could not be run appropriately.
Administrative user-interface to manage agents.
More generic, simple, and user-friendly framework for reinforcement learning and agent deployment.
Using Lerner on all available CIs jobs against all SDK versions.
Experiment with different neural network architectures.
If you would like to be a part of our team, come join us.
Hack Days are a big deal at Netflix. They’re a chance to bring together employees from all our different disciplines to explore new ideas and experiment with emerging technologies.
For the most recent hack day, we channeled our creative energy towards our studio efforts. The goal remained the same: team up with new colleagues and have fun while learning, creating, and experimenting. We know even the silliest idea can spur something more.
The most important value of hack days is that they support a culture of innovation. We believe in this work, even if it never ships, and love to share the creativity and thought put into these ideas.
Below, you can find videos made by the hackers of some of our favorite hacks from this event.
Project Rumble Pack
You’re watching your favorite episode of Voltron when, after a suspenseful pause, there’s a huge explosion — and your phone starts to vibrate in your hands.
The Project Rumble Pak hack day project explores how haptics can enhance the content you’re watching. With every explosion, sword clank, and laser blast, you get force feedback to amp up the excitement.
For this project, we synchronized Netflix content with haptic effects using Immersion Corporation technology.
Introducing The Voice of Netflix. We trained a neural net to spot words in Netflix content and reassemble them into new sentences on demand. For our stage demonstration, we hooked this up to a speech recognition engine to respond to our verbal questions in the voice of Netflix’s favorite characters. Try it out yourself at blogofsomeguy.com/v!
TerraVision re-envisions the creative process and revolutionizes the way our filmmakers can search and discover filming locations. Filmmakers can drop a photo of a look they like into an interface and find the closest visual matches from our centralized library of locations photos. We are using a computer vision model trained to recognize places to build reverse image search functionality. The model converts each image into a small dimensional vector, and the matches are obtained by computing the nearest neighbors of the query.
Have you ever found yourself needing to give the Evil Eye™ to colleagues who are hogging your conference room after their meeting has ended?
Our hack is a simple web application that allows employees to select a Netflix meeting room anywhere in the world, and press a button to kick people out of their meeting room if they have overstayed their meeting. First, the app looks up calendar events associated with the room and finds the latest meeting in the room that should have already ended. It then automatically calls in to that meeting and plays walk-off music similar to the Oscar’s to not-so-subtly encourage your colleagues to Get Out! We built this hack using Java (Springboot framework), the Google OAuth and Calendar APIs (for finding rooms) and Twilio API (for calling into the meeting), and deployed it on AWS.
Bringing Rich Experiences to Memory-Constrained TV Devices
By Jason Munning, Archana Kumar, Kris Range
Netflix has over 148M paid members streaming on more than half a billion devices spanning over 1,900 different types. In the TV space alone, there are hundreds of device types that run the Netflix app. We need to support the same rich Netflix experience on not only high-end devices like the PS4 but also memory and processor-constrained consumer electronic devices that run a similar chipset as was used in an iPhone 3Gs.
In a previous post, we described how our TV application consists of a C++ SDK installed natively on the device, an updatable JavaScript user interface (UI) layer, and a custom rendering layer known as Gibbon. We ship the same UI to thousands of different devices in order to deliver a consistent user experience. As UI engineers we are excited about delivering creative and engaging experiences that help members choose the content they will love so we are always trying to push the limits of our UI.
In this post, we will discuss the development of the Rich Collection row and the iterations we went through to be able to support this experience across the majority of the TV ecosystem.
Rich Collection Row
One of our most ambitious UI projects to date on the TV app is the animated Rich Collection Row. The goal of this experience from a UX design perspective was to bring together a tightly-related set of original titles that, though distinct entities on their own, also share a connected universe. We hypothesized this design would net a far greater visual impact than if the titles were distributed individually throughout the page. We wanted the experience to feel less like scrolling through a row and more like exploring a connected world of stories.
For the collections below, the row is composed of characters representing each title in a collected universe overlaid onto a shared, full-bleed background image which depicts the shared theme for the collection. When the user first scrolls down to the row, the characters are grouped into a lineup of four. The name of the collection animates in along with the logos for each title while a sound clip plays which evokes the mood of the shared world. The characters slide off screen to indicate the first title is selected. As the user scrolls horizontally, characters slide across the screen and the shared backdrop scrolls with a parallax effect. For some of the collections, the character images themselves animate and a full-screen tint is applied using a color that is representative of the show’s creative (see “Character Images” below).
Once the user pauses on a title for more than two seconds, the trailer for that title cross-fades with the background image and begins playing.
Development
As part of developing this type of UI experience on any platform, we knew we would need to think about creating smooth, performant animations with a balance between quality and download size for the images and video previews, all without degrading the performance of the app. Some of the metrics we use to measure performance on the Netflix TV app include animation frames per second (FPS), key input responsiveness (the amount of time before a member’s key press renders a change in the UI), video playback speed, and app start-up time.
UI developers on the Netflix TV app also need to consider some challenges that developers on other platforms often are able to take for granted. One such area is our graphics memory management. While web browsers and mobile phones have gigabytes of memory available for graphics, our devices are constrained to mere MBs. Our UI runs on top of a custom rendering engine which uses what we call a “surface cache” to optimize our use of graphics memory.
Surface Cache
Surface cache is a reserved pool in main memory (or separate graphics memory on a minority of systems) that the Netflix app uses for storing textures (decoded images and cached resources). This benefits performance as these resources do not need to be re-decoded on every frame, saving CPU time and giving us a higher frame-rate for animations.
Each device running the Netflix TV application has a limited surface cache pool available so the rendering engine tries to maximize the usage of the cache as much as possible. This is a positive for the end experience because it means more textures are ready for re-use as a customer navigates around the app.
The amount of space a texture requires in surface cache is calculated as:
width * height * 4 bytes/pixel (for rgba)
Most devices currently run a 1280 x 720 Netflix UI. A full-screen image at this resolution will use 1280 * 720 * 4 = 3.5MB of surface cache. The majority of legacy devices run at 28MB of surface cache. At this size, you could fit the equivalent of 8 full-screen images in the cache. Reserving this amount of memory allows us to use transition effects between screens, layering/parallax effects, and to pre-render images for titles that are just outside the viewport to allow scrolling in any direction without images popping in. Devices in the Netflix TVUI ecosystem have a range of surface cache capacity, anywhere from 20MB to 96MB and we are able to enable/disable rich features based on that capacity.
When the limit of this memory pool is approached or exceeded, the Netflix TV app tries to free up space with resources it believes it can purge (i.e. images no longer in the viewport). If the cache is over budget with surfaces that cannot be purged, devices can behave in unpredictable ways ranging from application crashes, displaying garbage on the screen, or drastically slowing down animations.
Surface Cache and the Rich Collection Row
From developing previous rich UI features, we knew that surface cache usage was something to consider with the image-heavy design for the Rich Collection row. We made sure to test memory usage early on during manual testing and did not see any overages so we checked that box and proceeded with development. When we were approaching code-complete and preparing to roll out this experience to all users we ran our new code against our memory-usage automation suite as a sanity check.
The chart below shows an end-to-end automated test that navigates the Netflix app, triggering playbacks, searches, etc to simulate a user session. In this case, the test was measuring surface cache after every step. The red line shows a test run with the Rich Collection row and the yellow line shows a run without. The dotted red line is placed at 28MB which is the amount of memory reserved for surface cache on the test device.
Automation run showing surface cache size vs test step
Uh oh! We found some massive peaks (marked in red) in surface cache that exceeded our maximum recommended surface cache usage of 28MB and indicated we had a problem. Exceeding the surface cache limit can have a variety of impacts (depending on the device implementation) to the user from missing images to out of memory crashes. Time to put the brakes on the rollout and debug!
Assessing the Problem
The first step in assessing the problem was to drill down into our automation results to make sure they were valid. We re-ran the automation tests and found the results were reproducible. We could see the peaks were happening on the home screen where the Rich Collection row was being displayed. It was odd that we hadn’t seen the surface cache over budget (SCOB) errors while doing manual testing.
To close the gap we took a look at the configuration settings we were using in our automation and adjusted them to match the settings we use in production for real devices. We then re-ran the automation and still saw the peaks but in the process we discovered that the issue seemed to only present itself on devices running a version of our SDK from 2015. The manual testing hadn’t caught it because we had only been manually testing surface cache on more recent versions of the SDK. Once we did manual testing on our older SDK version we were able to reproduce the issue in our development environment.
An example console output showing surface cache over budget errors
During brainstorming with our platform team, we came across an internal bug report from 2017 that described a similar issue to what we were seeing — surfaces that were marked as purgeable in the surface cache were not being fully purged in this older version of our SDK. From the ticket we could see that the inefficiency was fixed in the next release of our SDK but, because not all devices get Netflix SDK updates, the fix could not be back-ported to the 2015 version that had this issue. Considering that a significant share of our actively-used TV devices are running this 2015 version and won’t be updated to a newer SDK, we knew we needed to find a fix that would work for this specific version — a similar situation to the pre-2000 world before browsers auto-updated and developers had to code to specific browser versions.
Finding a Solution
The first step was to take a look at what textures were in the surface cache (especially those marked as un-purgeable) at the time of the overage and see where we might be able to make gains by reducing the size of images. For this we have a debug port that allows us to inspect which images are in the cache. This shows us information about the images in the surface cache including url. The links can then be hovered over to show a small thumbnail of the image.
From snapshots such as this one we could see the Rich Collection row alone filled about 15.3MB of surface cache which is >50% of the 28MB total graphics memory available on devices running our 2015 SDK.
The largest un-purgeable images we found were:
Character images (6 * 1MB)
Background images for the parallax background (2 * 2.9MB)
Unknown — a full screen blank white rectangle (3.5MB)
Character Images
Some of our rich collections featured the use of animated character assets to give an even richer experience. We created these assets using a Netflix-proprietary animation format called a Scriptable Network Graphic (SNG) which was first supported in 2017 and is similar to an animated PNG. The SNG files have a relatively large download size at ~1.5MB each. In order to ensure these assets are available at the time the rich collection row enters the viewport, we preload the SNGs during app startup and save them to disk. If the user relaunches the app in the future and receives the same collection row, the SNG files can be read from the disk cache, avoiding the need to download them again. Devices running an older version of the SDK fallback to a static character image.
Marvel Collection row with animated character images
At the time of the overage we found thatsix character images were present in the cache — four on the screen and two preloaded off of the screen. Our first savings came from only preloading one image for a total of five characters in the cache. Right off the bat this saved us almost 7% in surface cache with no observable impact to the experience.
Next we created cropped versions of the static character images that did away with extra transparent pixels (that still count toward surface cache usage!). This required modifications to the image pipeline in order to trim the whitespace but still maintain the relative size of the characters — so the relative heights of the characters in the lineup would still be preserved. The cropped character assets used only half of the surface cache memory of the full-size images and again had no visible impact to the experience.
Full-size vs cropped character image
Parallax Background
In order to achieve the illusion of a continuously scrolling parallax background, we were using two full screen background images essentially placed side by side which together accounted for ~38% of the experience’s surface cache usage. We worked with design to create a new full-screen background image that could be used for a fallback experience (without parallax) on devices that couldn’t support loading both of the background images for the parallax effect. Using only one background image saved us 19% in surface cache for the fallback experience.
Unknown Widget
After trial and error removing React components from our local build and inspecting the surface cache we found that the unknown widget that showed as a full screen blank white rectangle in our debug tool was added by the full-screen tint effect we were using. In order to apply the tint, the graphics layer essentially creates a full screen texture that is colored dynamically and overlaid over the visible viewport. Removing the tint overlay saved us 23% in surface cache.
Removing the tint overlay and using a single background image gave us a fallback experience that used 42% less surface cache than the full experience.
Marvel Collection row fallback experience with static characters, no full-screen tint, and single background
When all was said and done, the surface cache usage of the fallback experience (including fewer preloaded characters, cropped character images, a single background, and no tint overlay) clocked in at about 5MB which gave us a total savings of almost 67% over our initial implementation.
We were able to target this fallback experience to devices running the 2015 and older SDK, while still serving the full rich experience (23% lower surface cache usage than the original implementation) to devices running the new SDKs.
Rollout
At this point our automation was passing so we began slowly rolling out this experience to all members. As part of any rollout, we have a dashboard of near real-time metrics that we monitor. To our chagrin we saw that another class of devices — those running the 2017 SDK — also were reporting higher SCOB errors than the control.
Total number of SCOB errors vs time
Thanks to our work on the fallback experience we were able to change the configuration for this class of devices on the fly to serve the fallback experience (without parallax background and tint). We found if we used the fallback experience we could still get away with using the animated characters. So yet another flavor of the experience was born.
Improvements and Takeaways
At Netflix we strive to move fast in innovation and learn from all projects whether they are successes or failures. From this project, we learned that there were gaps in our understanding of how our underlying graphics memory worked and in the tooling we used to monitor that memory. We kicked off an effort to understand this graphics memory space at a low level and compiled a set of best practices for developers beginning work on a project. We also documented a set of tips and tools for debugging and optimizing surface cache should a problem arise.
As part of that effort, we expanded our suite of build-over-build automated tests to increase coverage across our different SDK versions on real and reference devices to detect spikes/regressions in our surface cache usage.
Surface cache usage per build
We began logging SCOB errors with more detail in production so we can target the specific areas of the app that we need to optimize. We also are now surfacing surface cache errors as notifications in the dev environment so developers can catch them sooner.
And we improved our surface cache inspector tool to be more user friendly and to integrate with our Chrome DevTools debugger:
New internal tool for debugging surface cache
Conclusion
As UI engineers on the TVUI platform at Netflix, we have the challenge of delivering ambitious UI experiences to a highly fragmented ecosystem of devices with a wide range of performance characteristics. It’s important for us to reach as many devices as possible in order to give our members the best possible experience.
The solutions we developed while scaling the Rich Collection row have helped inform how we approach ambitious UI projects going forward. With our optimizations and fallback experiences we were able to almost double the number of devices that were able to get the Rich Collection row.
We are now more thoughtful about designing fallback experiences that degrade gracefully as part of the initial design phase instead of just as a reaction to problems we encounter in the development phase. This puts us in a position of being able to scale an experience very quickly with a set of knobs and levers that can be used to tune an experience for a specific class of devices.
Most importantly, we received feedback that our members enjoyed our Rich Collection row experience — both the full and fallback experiences — when we rolled them out globally at the end of 2018.
If this interests you and want to help build the future UIs for discovering and watching shows and movies, join our team!
This is the story about how the Content Setup Engineering team used Hollow, a Netflix OSS technology, to re-architect and simplify an essential component in our content pipeline — delivering a large amount of business value in the process.
The Context
Each movie and show on the Netflix service is carefully curated to ensure an optimal viewing experience. The team responsible for this curation is Title Operations. Title Operations will confirm, among other things:
We are in compliance with the contracts — date ranges and places where we can show a video are set up correctly for each title
Video with captions, subtitles, and secondary audio “dub” assets are sourced, translated, and made available to the right populations around the world
Title name and synopsis are available and translated
The appropriate maturity ratings are available for each country
When a title meets all of the minimum above requirements, then it is allowed to go live on the service. Gatekeeper is the system at Netflix responsible for evaluating the “liveness” of videos and assets on the site. A title doesn’t become visible to members until Gatekeeper approves it — and if it can’t validate the setup, then it will assist Title Operations by pointing out what’s missing from the baseline customer experience.
Gatekeeper accomplishes its prescribed task by aggregating data from multiple upstream systems, applying some business logic, then producing an output detailing the status of each video in each country.
The Tech
Hollow, an OSS technology we released a few years ago, has been best described as a total high-density near cache:
Total: The entire dataset is cached on each node — there is no eviction policy, and there are no cache misses.
High-Density: encoding, bit-packing, and deduplication techniques are employed to optimize the memory footprint of the dataset.
Near: the cache exists in RAM on any instance which requires access to the dataset.
One exciting thing about the total nature of this technology — because we don’t have to worry about swapping records in-and-out of memory, we can make assumptions and do some precomputation of the in-memory representation of the dataset which would not otherwise be possible. The net result is, for many datasets, vastly more efficient use of RAM. Whereas with a traditional partial-cache solution you may wonder whether you can get away with caching only 5% of the dataset, or if you need to reserve enough space for 10% in order to get an acceptable hit/miss ratio — with the same amount of memory Hollow may be able to cache 100% of your dataset and achieve a 100% hit rate.
And obviously, if you get a 100% hit rate, you eliminate all I/O required to access your data — and can achieve orders of magnitude more efficient data access, which opens up many possibilities.
The Status-Quo
Until very recently, Gatekeeper was a completely event-driven system. When a change for a video occurred in any one of its upstream systems, that system would send an event to Gatekeeper. Gatekeeper would react to that event by reaching into each of its upstream services, gathering the necessary input data to evaluate the liveness of the video and its associated assets. It would then produce a single-record output detailing the status of that single video.
Old Gatekeeper Architecture
This model had several problems associated with it:
This process was completely I/O bound and put a lot of load on upstream systems.
Consequently, these events would queue up throughout the day and cause processing delays, which meant that titles may not actually go live on time.
Worse, events would occasionally get missed, meaning titles wouldn’t go live at all until someone from Title Operations realized there was a problem.
The mitigation for these issues was to “sweep” the catalog so Videos matching specific criteria (e.g., scheduled to launch next week) would get events automatically injected into the processing queue. Unfortunately, this mitigation added many more events into the queue, which exacerbated the problem.
Clearly, a change in direction was necessary.
The Idea
We decided to employ a total high-density near cache (i.e., Hollow) to eliminate our I/O bottlenecks. For each of our upstream systems, we would create a Hollow dataset which encompasses all of the data necessary for Gatekeeper to perform its evaluation. Each upstream system would now be responsible for keeping its cache updated.
New Gatekeeper Architecture
With this model, liveness evaluation is conceptually separated from the data retrieval from upstream systems. Instead of reacting to events, Gatekeeper would continuously process liveness for all assets in all videos across all countries in a repeating cycle. The cycle iterates over every video available at Netflix, calculating liveness details for each of them. At the end of each cycle, it produces a complete output (also a Hollow dataset) representing the liveness status details of all videos in all countries.
We expected that this continuous processing model was possible because a complete removal of our I/O bottlenecks would mean that we should be able to operate orders of magnitude more efficiently. We also expected that by moving to this model, we would realize many positive effects for the business.
A definitive solution for the excess load on upstream systems generated by Gatekeeper
A complete elimination of liveness processing delays and missed go-live dates.
A reduction in the time the Content Setup Engineering team spends on performance-related issues.
Improved debuggability and visibility into liveness processing.
The Problem
Hollow can also be thought of like a time machine. As a dataset changes over time, it communicates those changes to consumers by breaking the timeline down into a series of discrete data states. Each data state represents a snapshot of the entire dataset at a specific moment in time.
Hollow is like a time machine
Usually, consumers of a Hollow dataset are loading the latest data state and keeping their cache updated as new states are produced. However, they may instead point to a prior state — which will revert their view of the entire dataset to a point in the past.
The traditional method of producing data states is to maintain a single producer which runs a repeating cycle. During that cycle, the producer iterates over all records from the source of truth. As it iterates, it adds each record to the Hollow library. Hollow then calculates the differences between the data added during this cycle and the data added during the last cycle, then publishes the state to a location known to consumers.
Traditional Hollow usage
The problem with this total-source-of-truth iteration model is that it can take a long time. In the case of some of our upstream systems, this could take hours. This data-propagation latency was unacceptable — we can’t wait hours for liveness processing if, for example, Title Operations adds a rating to a movie that needs to go live imminently.
The Improvement
What we needed was a faster time machine — one which could produce states with a more frequent cadence, so that changes could be more quickly realized by consumers.
Incremental Hollow is like a faster time machine
To achieve this, we created an incremental Hollow infrastructure for Netflix, leveraging work which had been done in the Hollow library earlier, and pioneered in productionusage by the Streaming Platform Team at Target (and is now a public non-beta API).
With this infrastructure, each time a change is detected in a source application, the updated record is encoded and emitted to a Kafka topic. A new component that is not part of the source application, the Hollow Incremental Producer service, performs a repeating cycle at a predefined cadence. During each cycle, it reads all messages which have been added to the topic since the last cycle and mutates the Hollow state engine to reflect the new state of the updated records.
If a message from the Kafka topic contains the exact same data as already reflected in the Hollow dataset, no action is taken.
Hollow Incremental Producer Service
To mitigate issues arising from missed events, we implement a sweep mechanism that periodically iterates over an entire source dataset. As it iterates, it emits the content of each record to the Kafka topic. In this way, any updates which may have been missed will eventually be reflected in the Hollow dataset. Additionally, because this is not the primary mechanism by which updates are propagated to the Hollow dataset, this does not have to be run as quickly or frequently as a cycle must iterate the source in traditional Hollow usage.
The Hollow Incremental Producer is capable of reading a great many messages from the Kafka topic and mutating its Hollow state internally very quickly — so we can configure its cycle times to be very short (we are currently defaulting this to 30 seconds).
This is how we built a faster time machine. Now, if Title Operations adds a maturity rating to a movie, within 30 seconds, that data is available in the corresponding Hollow dataset.
The Tangible Result
With the data propagation latency issue solved, we were able to re-implement the Gatekeeper system to eliminate all I/O boundaries. With the prior implementation of Gatekeeper, re-evaluating all assets for all videos in all countries would have been unthinkable — it would tie up the entire content pipeline for more than a week (and we would then still be behind by a week since nothing else could be processed in the meantime). Now we re-evaluate everything in about 30 seconds — and we do that every minute.
There is no such thing as a missed or delayed liveness evaluation any longer, and the disablement of the prior Gatekeeper system reduced the load on our upstream systems — in some cases by up to 80%.
Load reduction on one upstream system
In addition to these performance benefits, we also get a resiliency benefit. In the prior Gatekeeper system, if one of the upstream services went down, we were unable to evaluate liveness at all because we were unable to retrieve any data from that system. In the new implementation, if one of the upstream systems goes down then it does stop publishing — but we still gate stale data for its corresponding dataset while all others make progress. So for example, if the translated synopsis system goes down, we can still bring a movie on-site in a region if it was held back for, and then receives, the correct subtitles.
The Intangible Result
Perhaps even more beneficial than the performance gains has been the improvement in our development velocity in this system. We can now develop, validate, and release changes in minutes which might have before taken days or weeks — and we can do so with significantly increased release quality.
The time-machine aspect of Hollow means that every deterministic process which uses Hollow exclusively as input data is 100% reproducible. For Gatekeeper, this means that an exact replay of what happened at time X can be accomplished by reverting all of our input states to time X, then re-evaluating everything again.
We use this fact to iterate quickly on changes to the Gatekeeper business logic. We maintain a PREPROD Gatekeeper instance which “follows” our PROD Gatekeeper instance. PREPROD is also continuously evaluating liveness for the entire catalog, but publishing its output to a different Hollow dataset. At the beginning of each cycle, the PREPROD environment will gather the latest produced state from PROD, and set each of its input datasets to the exact same versions which were used to produce the PROD output.
The PREPROD Gatekeeper instance “follows” the PROD instance
When we want to make a change to the Gatekeeper business logic, we do so and then publish it to our PREPROD cluster. The subsequent output state from PREPROD can be diffed with its corresponding output state from PROD to view the precise effect that the logic change will cause. In this way, at a glance, we can validate that our changes have precisely the intended effect, and zero unintended consequences.
A Hollow diff shows exactly what changes
This, coupled with some iteration on the deployment process, has resulted in the ability for our team to code, validate, and deploy impactful changes to Gatekeeper in literally minutes — at least an order of magnitude faster than in the prior system — and we can do so with a higher level of safety than was possible in the previous architecture.
Conclusion
This new implementation of the Gatekeeper system opens up opportunities to capture additional business value, which we plan to pursue over the coming quarters. Additionally, this is a pattern that can be replicated to other systems within the Content Engineering space and elsewhere at Netflix — already a couple of follow-up projects have been launched to formalize and capitalize on the benefits of this n-hollow-input, one-hollow-output architecture.
Content Setup Engineering is an exciting space right now, especially as we scale up our pipeline to produce more content with each passing quarter. We have many opportunities to solve real problems and provide massive value to the business — and to do so with a deep focus on computer science, using and often pioneering leading-edge technologies. If this kind of work sounds appealing to you, reach out to Ivan to get the ball rolling.
Conductor is a workflow orchestration engine developed and open-sourced by Netflix. If you’re new to Conductor, this earlier blogpost and the documentation should help you get started and acclimatized to Conductor.
In the last two years since inception, Conductor has seen wide adoption and is instrumental in running numerous core workflows at Netflix. Many of the Netflix Content and Studio Engineering services rely on Conductor for efficient processing of their business flows. The Netflix Media Database (NMDB) is one such example.
In this blog, we would like to present the latest updates to Conductor, address some of the frequently asked questions and thank the community for their contributions.
How we’re using Conductor at Netflix
Deployment
Conductor is one of the most heavily used services within Content Engineering at Netflix. Of the multitude of modules that can be plugged into Conductor as shown in the image below, we use the Jersey server module, Cassandra for persisting execution data, Dynomite for persisting metadata, DynoQueues as the queuing recipe built on top of Dynomite, Elasticsearch as the secondary datastore and indexer, and Netflix Spectator + Atlas for Metrics. Our cluster size ranges from 12–18 instances of AWS EC2 m4.4xlarge instances, typically running at ~30% capacity.
* — Cassandra persistence module is a partial implementation.
We do not maintain an internal fork of Conductor within Netflix. Instead, we use a wrapper that pulls in the latest version of Conductor and adds Netflix infrastructure components and libraries before deployment. This allows us to proactively push changes to the open source version while ensuring that the changes are fully functional and well-tested.
Adoption
As of writing this blog, Conductor orchestrates 600+ workflow definitions owned by 50+ teams across Netflix. While we’re not (yet) actively measuring the nth percentiles, our production workloads speak for Conductor’s performance. Below is a snapshot of our Kibana dashboard which shows the workflow execution metrics over a typical 7-day period.
Typical Conductor usage at Netflix over a 7 day period.
Use Cases
Some of the use cases served by Conductor at Netflix can be categorized under:
Content Ingest and Delivery
Content Quality Control
Content Localization
Encodes and Deployments
IMF Deliveries
Marketing Tech
Studio Engineering
What’s New
gRPC Framework
One of the key features in v2.0 was the introduction of the gRPC framework as an alternative/auxiliary to REST. This was contributed by our counterparts at GitHub, thereby strengthening the value of community contributions to Conductor.
Cassandra Persistence Layer
To enable horizontal scaling of the datastore for large volume of concurrent workflow executions (millions of workflows/day), Cassandra was chosen to provide elastic scaling and meet throughput demands.
External Payload Storage
External payload storage was implemented to prevent the usage of Conductor as a data persistence system and to reduce the pressure on its backend datastore.
Dynamic Workflow Executions
For use cases where the need arises to execute a large/arbitrary number of varying workflow definitions or to run a one-time ad hoc workflow for testing or analytical purposes, registering definitions first with the metadata store in order to then execute them only once, adds a lot of additional overhead. The ability to dynamically create and execute workflows removes this friction. This was another great addition that stemmed from our collaboration with GitHub.
Workflow Status Listener
Conductor can be configured to publish notifications to external systems or queues upon completion/termination of workflows. The workflow status listener provides hooks to connect to any notification system of your choice. The community has contributed an implementation that publishes a message on a dyno queue based on the status of the workflow. An event handler can be configured on these queues to trigger workflows or tasks to perform specific actions upon the terminal state of the workflow.
Bulk Workflow Management
There has always been a need for bulk operations at the workflow level from an operability standpoint. When running at scale, it becomes essential to perform workflow level operations in bulk due to bad downstream dependencies in the worker processes causing task failures or bad task executions. Bulk APIs enable the operators to have macro-level control on the workflows executing within the system.
Decoupling Elasticsearch from Persistence
This inter-dependency was removed by moving the indexing layer into separate persistence modules, exposing a property (workflow.elasticsearch.instanceType) to choose the type of indexing engine. Further, the indexer and persistence layer have been decoupled by moving this orchestration from within the primary persistence layer to a service layer through the ExecutionDAOFacade.
ES5/6 Support
Support for Elasticsearch versions 5 and 6 have been added as part of the major version upgrade to v2.x. This addition also provides the option to use the Elasticsearch RestClient instead of the Transport Client which was enforced in the previous version. This opens the route to using a managed Elasticsearch cluster (a la AWS) as part of the Conductor deployment.
Task Rate Limiting & Concurrent Execution Limits
Task rate limiting helps achieve bounded scheduling of tasks. The task definition parameter rateLimitFrequencyInSeconds sets the duration window, while rateLimitPerFrequency defines the number of tasks that can be scheduled in a duration window. On the other hand, concurrentExecLimit provides unbounded scheduling limits of tasks. I.e the total of current scheduled tasks at any given time will be under concurrentExecLimit. The above parameters can be used in tandem to achieve desired throttling and rate limiting.
API Validations
Validation was one of the core features missing in Conductor 1.x. To improve usability and operability, we added validations, which in practice has greatly helped find bugs during creation of workflow and task definitions. Validations enforce the user to create and register their task definitions before registering the workflow definitions using these tasks. It also ensures that the workflow definition is well-formed with correct wiring of inputs and outputs in the various tasks within the workflow. Any anomalies found are reported to the user with a detailed error message describing the reason for failure.
Developer Labs, Logging and Metrics
We have been continually improving logging and metrics, and revamped the documentation to reflect the latest state of Conductor. To provide a smooth on boarding experience, we have created developer labs, which guides the user through creating task and workflow definitions, managing a workflow lifecycle, configuring advanced workflows with eventing etc., and a brief introduction to Conductor API, UI and other modules.
New Task Types
System tasks have proven to be very valuable in defining the Workflow structure and control flow. As such, Conductor 2.x has seen several new additions to System tasks, mostly contributed by the community:
Lambda
Lambda Task executes ad-hoc logic at Workflow run-time, using the Nashorn Javascript evaluator engine. Instead of creating workers for simple evaluations, Lambda task enables the user to do this inline using simple Javascript expressions.
Terminate
Terminate task is useful when workflow logic should terminate with a given output. For example, if a decision task evaluates to false, and we do not want to execute remaining tasks in the workflow, instead of having a DECISION task with a list of tasks in one case and an empty list in the other, this can scope the decide and terminate workflow execution.
ExclusiveJoin
Exclusive Join task helps capture task output from a DECISION task’s flow. This is useful to wire task inputs from the outputs of one of the cases within a decision flow. This data will only be available during workflow execution time and the ExclusiveJoin task can be used to collect the output from one of the tasks in any of decision branches.
For in-depth implementation details of the new additions, please refer the documentation.
What’s next
There are a lot of features and enhancements we would like to add to Conductor. The below wish list could be considered as a long-term road map. It is by no means exhaustive, and we are very much welcome to ideas and contributions from the community. Some of these listed in no particular order are:
Advanced Eventing with Event Aggregation and Distribution
At the moment, event generation and processing is a very simple implementation. An event task can create only one message, and a task can wait for only one event.
We envision an Event Aggregation and Distribution mechanism that would open up Conductor to a multitude of use-cases. A coarse idea is to allow a task to wait for multiple events, and to progress several tasks based on one event.
UI Improvements
While the current UI provides a neat way to visualize and track workflow executions, we would like to enhance this with features like:
Creating metadata objects from UI
Support for starting workflows
Visualize execution metrics
Admin dashboard to show outliers
New Task types like Goto, Loop etc.
Conductor has been using a Directed Acyclic Graph (DAG) structure to define a workflow. The Goto and Loop on tasks are valid use cases, which would deviate from the DAG structure. We would like to add support for these tasks without violating the existing workflow execution rules. This would help unlock several other use cases like streaming flow of data to tasks and others that require repeated execution of a set of tasks within a workflow.
Support for reusable commonly used tasks like Email, DatabaseQuery etc.
Similarly, we’ve seen the value of shared reusable tasks that does a specific thing. At Netflix internal deployment of Conductor, we’ve added tasks specific to services that users can leverage over recreating the tasks from scratch. For example, we provide a TitusTask which enables our users to launch a new Titus container as part of their workflow execution.
We would like to extend this idea such that Conductor can offer a repository of commonly used tasks.
Push based task scheduling interface
Current Conductor architecture is based on polling from a worker to get tasks that it will execute. We need to enhance the grpc modules to leverage the bidirectional channel to push tasks to workers as and when they are scheduled, thus reducing network traffic, load on the server and redundant client calls.
Validating Task inputKeys and outputKeys
This is to provide type safety for tasks and define a parameterized interface for task definitions such that tasks are completely re-usable within Conductor once registered. This provides a contract allowing the user to browse through available task definitions to use as part of their workflow where the tasks could have been implemented by another team/user. This feature would also involve enhancing the UI to display this contract.
Implementing MetadataDAO in Cassandra
As mentioned here, Cassandra module provides a partial implementation for persisting only the workflow executions. Metadata persistence implementation is not available yet and is something we are looking to add soon.
Pluggable Notifications on Task completion
Similar to the Workflow status listener, we would like to provide extensible interfaces for notifications on task execution.
Python client in Pypi
We have seen wide adoption of Python client within the community. However, there is no official Python client in Pypi, and lacks some of the newer additions to the Java client. We would like to achieve feature parity and publish a client from Conductor Github repository, and automate the client release to Pypi.
Removing Elasticsearch from critical path
While Elasticsearch is greatly useful in Conductor, we would like to make this optional for users who do not have Elasticsearch set-up. This means removing Elasticsearch from the critical execution path of a workflow and using it as an opt-in layer.
Pluggable authentication and authorization
Conductor doesn’t support authentication and authorization for API or UI, and is something that we feel would add great value and is a frequent request in the community.
Validations and Testing
Dry runs, i.e the ability to evaluate workflow definitions without actually running it through worker processes and all relevant set-up would make it much easier to test and debug execution paths.
If you would like to be a part of the Conductor community and contribute to one of the Wishlist items or something that you think would provide a great value add, please read through this guide for instructions or feel free to start a conversation on our Gitter channel, which is Conductor’s user forum.
We also highly encourage to polish, genericize and share any customizations that you may have built on top of Conductor with the community.
We really appreciate and are extremely proud of the community involvement, who have made several important contributions to Conductor. We would like to take this further and make Conductor widely adopted with a strong community backing.
Netflix Conductor is maintained by the Media Workflow Infrastructure team. If you like the challenges of building distributed systems and are interested in building the Netflix Content and Studio ecosystem at scale, connect with Charles Zhao to get the conversation started.
Thanks to Alexandra Pau, Charles Zhao, Falguni Jhaveri, Konstantinos Christidis and Senthil Sayeebaba.
Customizing Windows images at Netflix was a manual, error-prone, and time consuming process. In this blog post, we describe how we improved the methodology, which technologies we leveraged, and how this has improved service deployment and consistency.
Artisan Crafted Images
In the Netflix full cycle DevOps culture the team responsible for building a service is also responsible for deploying, testing, infrastructure, and operation of that service. A key responsibility of Netflix engineers is identifying gaps and pain points in the development and operation of services. Though the majority of our services run on Linux Amazon Machine Images (AMIs), there are still many services critical to the Netflix Playback Experience running on Windows Elastic Compute Cloud (EC2) instances at scale.
We looked at our process for creating a Windows AMI and discovered it was error-prone and full of toil. First, an engineer would launch an EC2 instance and wait for the instance to come online. Once the instance was available, the engineer would use a remote administration tool like RDP to login to the instance to install software and customize settings. This image was then saved as an AMI and used in an Auto Scale Group to deploy a cluster of instances. Because this process was time consuming and painful, our Windows instances were usually missing the latest security updates from Microsoft.
Last year, we decided to improve the AMI baking process. The challenges with service management included:
Stale documentation
OS Updates
High cognitive overhead
A lack of continuous testing
Scaling Image Creation
Our existing AMI baking tool Aminator does not support Windows so we had to leverage other tools. We had several goals in mind when trying to improve the baking methodology:
The first part of our new Windows baking solution is Packer. Packer allows you to describe your image customization process as a JSON file. We make use of the amazon-ebs Packer builder to launch an EC2 instance. Once online, Packer uses WinRM to copy files and run PowerShell scripts against the instance. If all of the configuration steps are successful then Packer saves a new AMI. The configuration file, referenced scripts, and artifact dependency definitions all live in an internal git repository. We now have the software and instance configuration as code. This means changes can be tracked and reviewed like any other code change.
Packer requires specific information for your baking environment and extensive AWS IAM permissions. In order to simplify the use of Packer for our software developers, we bundled Netflix-specific AWS environment information and helper scripts. Initially, we did this with a git repository and Packer variable files. There was also a special EC2 instance where Packer was executed as Jenkins jobs. This setup was better than manually baking images but we still had some ergonomic challenges. For example, it became cumbersome to ensure users of Packer received updates.
The last piece of the puzzle was finding a way to package our software for installation on Windows. This would allow for reuse of helper scripts and infrastructure tools without requiring every user to copy that solution into their Packer scripts. Ideally, this would work similar to how applications are packaged in the Animator process. We solved this by leveraging Chocolatey, the package manager for Windows. Chocolatey packages are created and then stored in an internal artifact repository. This repository is added as a source for the choco install command. This means we can create and reuse packages that help integrate Windows into the Netflix ecosystem.
Leverage Spinnaker for Continuous Delivery
The Base Dockerfile allows updates of Packer, helper scripts, and environment configuration to propagate through the entire Windows Baking process.
To make the baking process more robust we decided to create a Docker image that contains Packer, our environment configuration, and helper scripts. Downstream users create their own Docker images based on this base image. This means we can update the base image with new environment information and helper scripts, and users get these updates automatically. With their new Docker image, users launch their Packer baking jobs using Titus, our container management system. The Titus job produces a property file as part of a Spinnaker pipeline. The resulting property file contains the AMI ID and is consumed by later pipeline stages for deployment. Running the bake in Titus removed the single EC2 instance limitation, allowing for parallel execution of the jobs.
Now each change in the infrastructure is tested, canaried, and deployed like any other code change. This process is automated via a Spinnaker pipeline:
Example Spinnaker pipeline showing the bake, canary, and deployment stages.
In the canary stage, Kayenta is used to compare metrics between a baseline (current AMI) and the canary (new AMI). The canary stage will determine a score based on metrics such as CPU, threads, latency, and GC pauses. If this score is within a healthy threshold the AMI is deployed to each environment. Running a canary for each change and testing the AMI in production allows us to capture insights around impact on Windows updates, script changes, tuning web server configuration, among others.
Eliminate Toil
Automating these tedious operational tasks allows teams to move faster. Our engineers no longer have to manually update Windows, Java, Tomcat, IIS, and other services. We can easily test server tuning changes, software upgrades, and other modifications to the runtime environment. Every code and infrastructure change goes through the same testing and deployment pipeline.
Reaping the Benefits
Changes that used to require hours of manual work are now easy to modify, test, and deploy. Other teams can quickly deploy secure and reproducible instances in an automated fashion. Services are more reliable, testable, and documented. Changes to the infrastructure are now reviewed like any other code change. This removes unnecessary cognitive load and documents tribal knowledge. Removing toil has allowed the team to focus on other features and bug fixes. All of these benefits reduce the risk of a customer-affecting outage. Adopting the Immutable Server pattern for Windows using Packer and Chocolatey has paid big dividends.
Another day, another custom script to analyze an A/B test. Maybe you’ve done this before and have an old script lying around. If it’s new, it’s probably going to take some time to set up, right? Not at Netflix.
ABlaze: The standard view of analyses in the XP UI
Suppose you’re running a new video encoding test and theorize that the two new encodes should reduce play delay, a metric describing how long it takes for a video to play after you press the start button. You can look at ABlaze (our centralized A/B testing platform) and take a quick look at how it’s performing.
Simulated dataset that shows what the distribution of play delay may look like. Note that the new encodes perform well in the lower quantiles but worse in the higher ones
You notice that the first new encode (Cell 2 — Encode 1) increased the mean of the play delay but decreased the median!
After recreating the dataset, you can plot the raw numbers and perform custom analyses to understand the distribution of the data across test cells.
With our new platform for experimentation analysis, it’s easy for scientists to perfectly recreate analyses on their laptops in a notebook. They can then choose from a library of statistics and visualizations or contribute their own to get a deeper understanding of the metrics.
Extending the same view of ABlaze with other contributed models and visualizations
Why it Matters
Netflix runs on an A/B testing culture: nearly every decision we make about our product and business is guided by member behavior observed in test. At any point a Netflix user is in many different A/B tests orchestrated through ABlaze. This enables us to optimize their experience at speed. Our A/B tests range across UI, algorithms, messaging, marketing, operations, and infrastructure changes. A user might be in a title artwork test, personalization algorithm test, or a video encoding testing, or all three at the same time.
The analysis reports tell us whether or not a new experience made statistically significant changes to relevant metrics, such as member behavior, or technical metrics that describe streaming video quality. However, the default reports only provide a summary view of the data with some powerful but limited filtering options. Our data scientists often want to apply their knowledge of the business and statistics to fully understand the outcome of an experiment.
Instead of relying on engineers to productionize scientific contributions, we’ve made a strategic bet to build an architecture that enables data scientists to easily contribute.
The two main challenges with this approach are establishing an easy contribution framework and handling Netflix’s scale of data. When dealing with ‘big data’, it’s common to perform computation on frameworks like Apache Spark or Map Reduce. In order to reduce the learning curve of contributing analyses, we’ve decided to take an alternative path by performing all of our analyses on one machine. Due to compression and high performance computing, scientists can analyze billions of rows of raw data on their laptops using languages and statistical libraries they are familiar with like Python and R.
Challenges with Pre-existing Infrastructure
Netflix’s well-known experimentation culture was fueled by our previous infrastructure: an optimized framework that scaled to the wide variety of use cases across Netflix. But as our experimentation culture grew, so too did our product areas, users, and ambitions around more sophisticated methodology on measurement.
Our data scientists faced numerous challenges in our previous infrastructure. Complex business logic was embedded directly into the ETL pipelines by data engineers. In order to replicate results, scientists had to delve deep into the data, code, and documentation. Due to Netflix’s scale of over 150 million subscribers, scientists also frequently encountered issues while fetching data and performing custom statistical models in Python or R.
To offer new methods to the community and overcome any existing engineering barriers, scientists would have to run custom scripts outside of the centralized platform. Heavily used or high value scripts were sometimes converted into Shiny apps, allowing easy access to these novel features. However, because these apps lived separately from the platform, they could be difficult to maintain as the underlying data and platform evolved. Also, since these apps were generally written for specific use cases, they were difficult to generalize and graduate back into the platform.
Our scientists come from many backgrounds, such as neuroscience, biostatistics, economics, and physics; each of these backgrounds has a meaningful contribution to how experiments should be analyzed. Instead of spending their time wrangling data and conducting the same ad-hoc analyses multiple times, we would like our data scientists to focus on contributing new and innovative techniques for analyzing tests, such as Interleaving, Quantile Bootstrapping, Quasi Experiments, Quantile Regression, and Heterogeneous Treatment Effects. Additionally, as these new techniques are contributed, we want them to be effortlessly leveraged across the Netflix experimentation community.
Previous XP architecture: all systems are engineering-owned and not easily introspectable
Reimagining our Infrastructure: Democratization Across 3 Tracks
We are reimagining new infrastructure that makes the scientific development experience better. We’ve chosen to break down the contribution framework into 3 steps.
1. Getting Data with the Metrics Repo 2. Computing Statistics with Causal Models 3. Rendering Visualizations with Plotly
Democratization across 3 tracks: Metrics, Stats, Viz
The new architecture employs a modular design that permits data scientists to contribute using SQL, Python, and R, the tools of their trade. Users can contribute metrics and methods directly, without needing to master data engineering tools. We’ve also made sure that both production and local workflows use the same code base, so reproducibility is a given and promotion to production is just a pull request away.
New XP architecture: Systems highlighted in red are introspectable and contributable by data scientists
Getting data with Metrics Repo
Metrics Repo is an in-house Python framework where users define programmatically generated SQL queries and metric definitions. It centralizes metrics definitions which used to be scattered across many teams. Previously, many teams at Netflix had their own pipelines to calculate success metrics which caused a lot of fragmentation and discrepancies in calculations.
A key design decision of Metrics Repo is that it moves the last mile of metric computation away from engineering owned ETL pipelines into dynamically generated SQL. This allows scientists to add metrics and join arbitrary tables. The new architecture is much more flexible compared to the previous Spark based jobs. Views of reports are only calculated on demand and take a couple minutes to execute, so there are no migrations or backfills when making changes or updates to metrics. Adding a new metric is as easy as adding a new field or joining a different table in SQL. By leveraging PyPika, we represent each table as a Python class that can be customized with filters and additional joins. The code is self documenting and serializes to JSON so it can be easily exposed as an API.
Calculating Statistics with Causal Models
Causal Models is an in-house Python library that allows scientists to contribute generic models for causal inference. Previously, the centralized platform only had T-Test and Mann-Whitney while advanced statistical tests were only available via scripts or Shiny apps. Scientists can now add their statistical models by overriding two functions in a model subclass. Many of the models are simple wrappers over Scipy, but it’s flexible enough to do arbitrarily complex calculations. The library also provides helper methods which abstract accessing compressed or raw data. We use rpy2 so that models can be written in either R or Python.
We do not want data scientists to have to go outside of their comfort zone by writing Spark Scala or Map Reduce jobs. We also want to leverage the large ecosystem of statistical libraries written in Python and R. However, many analyses have raw datasets that don’t fit on one machine. So, we’ve implemented an optional compression layer that drastically reduces the size of the data. Depending on the statistic, the compression can be either lossless or tunably lossy. Additionally, we’ve structured the API so that model implementors don’t need to distinguish between compressed and uncompressed data. When contributing a new statistical test, the data scientist only needs to think about one comparison computation at a time. We take the functions that they’ve written and parallelize it for them through multi-processing.
Sometimes statistical models are expensive to run even on compressed data. It can be difficult to efficiently perform linear algebra operations in native Python or R. In those cases, our mathematical engineering team writes custom C++ in order to speed through those bottlenecks. Our scientists can then reference them easily in Python via pybind11 or in R via Rcpp.
As a result, innovative methods like Quantile Bootstrapping and OLS with heterogeneous effects are no longer confined to un-versioned controlled notebooks/scripts. The barrier to entry is very low to develop on the production system and sharing methods across metrics and business areas is effortless.
Rendering Visualizations with Plotly
In the old model, visualizations in the experimentation platform were created by UI engineers in React. The new architecture is still based on React, but we allow data scientists to contribute arbitrary graphs and plots using Plotly. We chose to use Plotly because it has a JSON specification that is implemented in many different frameworks and languages, including R and Python. Scientists can pick and choose from a wide variety of pre-made visualizations or create their own for others to use.
This work kickstarted an initiative called Netflix Vizkit to create a cross-library shared design that lowers the barrier for a unified look and feel in contributions.
Many scientists at Netflix primarily use notebooks for day to day development, so we wanted to make sure they could perform A/B test analysis on them as well. To ensure that the analysis shown in ABlaze can be replicated in a notebook, with e run the exact same code in both environments, even the visualizations!
Now scientists can easily introspect the data and extend it in an ad-hoc analysis. They can develop new metrics, statistical models, and visualizations in their notebooks and contribute it to the platform knowing the results will be identical because their exact code will be running in production. As a result, anyone at Netflix looking at ABlaze can now view these new contributions when looking at test analyses.
XP: Combining contributions into analyses
Next Steps
We aim to accelerate research in causal inference methodology, expedite product innovation, and ultimately delight our members. We’re looking forward to enhancing our frameworks to tackle experimentation automation. This is an ongoing journey. If you are passionate about the field, we have opportunities to join our dream team!
At Netflix we prioritize innovation and velocity in pursuit of the best experience for our 150+ million global customers. This means that our microservices constantly evolve and change, but what doesn’t change is our responsibility to provide a highly available service that delivers 100+ million hours of daily streaming to our subscribers.
In order to achieve this level of availability, we leverage an N+1 architecture where we treat Amazon Web Services (AWS) regions as fault domains, allowing us to withstand single region failures. In the event of an isolated failure we first pre-scale microservices in the healthy regions after which we can shift traffic away from the failing one. This pre-scaling is necessary due to our use of autoscaling, which generally means that services are right-sized to handle their current demand, not the surge they would experience once we shift traffic.
Though this evacuation capability exists today, this level of resiliency wasn’t always the standard for the Netflix API. In 2013 we first developed our multi-regional availability strategy in response to a catalyst that led us to re-architect the way our service operates. Over the last 6 years Netflix has continued to grow and evolve along with our customer base, invalidating core assumptions built into the machinery that powers our ability to pre-scale microservices. Two such assumptions were that:
Regional demand for all microservices (i.e. requests, messages, connections, etc.) can be abstracted by our key performance indicator, stream starts per second (SPS).
Microservices within healthy regions can be scaled uniformly during an evacuation.
These assumptions simplified pre-scaling, allowing us to treat microservices uniformly, ignoring the uniqueness and regionality of demand. This approach worked well in 2013 due to the existence of monolithic services and a fairly uniform customer base, but became less effective as Netflix evolved.
Invalidated Assumptions
Regional Microservice Demand
Most of our microservices are in some way related to serving a stream, so SPS seemed like a reasonable stand-in to simplify regional microservice demand. This was especially true for large monolithic services. For example, player logging, authorization, licensing, and bookmarks were initially handled by a single monolithic service whose demand correlated highly with SPS. However, in order to improve developer velocity, operability, and reliability, the monolith was decomposed into smaller, purpose-built services with dissimilar function-specific demand.
Our edge gateway (zuul) also sharded by function to achieve similar wins. The graph below captures the demand for each shard, the combined demand, and SPS. Looking at the combined demand and SPS lines, SPS roughly approximates combined demand for a majority of the day. Looking at individual shards however, the amount of error introduced by using SPS as a demand proxy varies widely.
Time of Day vs. Normalized Demand by Zuul Shard
Uniform Evacuation Scaling
Since we used SPS as a demand proxy, it also seemed reasonable to assume that we can uniformly pre-scale all microservices in the healthy regions. In order to illustrate the shortcomings of this approach, let’s look at playback licensing (DRM) & authorization.
DRM is closely aligned with device type, such that Consumer Electronics (CE), Android, & iOS use different DRM platforms. In addition, the ratio of CE to mobile streaming differs regionally; for example, mobile is more popular in South America. So, if we evacuate South American traffic to North America, demand for CE and Android DRM won’t grow uniformly.
On the other hand, playback authorization is a function used by all devices prior to requesting a license. While it does have some device specific behavior, demand during an evacuation is more a function of the overall change in regional demand.
Closing The Gap
In order to address the issues with our previous approach, we needed to better characterize microservice-specific demand and how it changes when we evacuate. The former requires that we capture regional demand for microservices versus relying on SPS. The latter necessitates a better understanding of microservice demand by device type as well as how regional device demand changes during an evacuation.
Microservice-Specific Regional Demand
Because of service decomposition, we understood that using a proxy demand metric like SPS wasn’t tenable and we needed to transition to microservice-specific demand. Unfortunately, due to the diversity of services, a mix of Java (Governator/Springboot with Ribbon/gRPC, etc.) and Node (NodeQuark), there wasn’t a single demand metric we could rely on to cover all use cases. To address this, we built a system that allows us to associate each microservice with metrics that represent their demand.
The microservice metrics are configuration-driven, self-service, and allows for scoping such that services can have different configurations across various shards and regions. Our system then queries Atlas, our time series telemetry platform, to gather the appropriate historical data.
Microservice Demand By Device Type
Since demand is impacted by regional device preferences, we needed to deconstruct microservice demand to expose the device-specific components. The approach we took was to partition a microservice’s regional demand by aggregated device types (CE, Android, PS4, etc.). Unfortunately, the existing metrics didn’t uniformly expose demand by device type, so we leveraged distributed tracing to expose the required details. Using this sampled trace data we can explain how a microservice’s regional device type demand changes over time. The graph below highlights how relative device demand can vary throughout the day for a microservice.
Regional Microservice Demand By Device Type
Device Type Demand
We can use historical device type traffic to understand how to scale the device-specific components of a service’s demand. For example, the graph below shows how CE traffic in us-east-1 changes when we evacuate us-west-2. The nominal and evacuation traffic lines are normalized such that 1 represents the max(nominal traffic) and the demand scaling ratio represents the relative change in demand during an evacuation (i.e. evacuation traffic/nominal traffic).
Nominal vs Evacuation CE Traffic in US-East-1
Microservice-Specific Demand Scaling Ratio
We can now combine microservice demand by device and device-specific evacuation scaling ratios to better represent the change in a microservice’s regional demand during an evacuation — i.e. the microservice’s device type weighted demand scaling ratio. To calculate this ratio (for a specific time of day) we take a service’s device type percentages, multiply by device type evacuation scaling ratios, producing each device type’s contribution to the service’s scaling ratio. Summing these components then yields a device type weighted evacuation scaling ratio for the microservice. To provide a concrete example, the table below shows the evacuation scaling ratio calculation for a fictional service.
Service Evacuation Scaling Ratio Calculation
The graph below highlights the impact of using a microservice-specific evacuation scaling ratio versus the simplified SPS-based approach used previously. In the case of Service A, the old approach would have done well in approximating the ratio, but in the case of Service B and Service C, it would have resulted in over and under predicting demand, respectively.
Device Type Weighted vs. Previous Approach
What Now?
Understanding the uniqueness of demand across our microservices improved the quality of our predictions, leading to safer and more efficient evacuations at the cost of additional computational complexity. This new approach, however, is itself an approximation with its own set of assumptions. For example, it assumes all categories of traffic for a device type has similar shape, for example Android logging and playback traffic. As Netflix grows our assumptions will again be challenged and we will have to adapt to continue to provide our customers with the availability and reliability that they have come to expect.
If this article has piqued your interest and you have a passion for solving cross-discipline distributed systems problems, our small but growing team is hiring!
It is a commonly observed pattern for applications to utilize multiple datastores where each is used to serve a specific need such as storing the canonical form of data (MySQL etc.), providing advanced search capabilities (ElasticSearch etc.), caching (Memcached etc.), and more. Typically when using multiple datastores, one of them acts as the primary store, and the others as derived stores. Now the challenge becomes how to keep these datastores in sync.
We have observed a series of distinct patterns which have tried to address multi-datastore synchronization, such as dual writes, distributed transactions, etc. However, these approaches have limitations in regards to feasibility, robustness, and maintenance. Beyond data synchronization, some applications also need to enrich their data by calling external services.
To address these challenges, we developed Delta. Delta is an eventual consistent, event driven, data synchronization and enrichment platform.
Existing Solutions
Dual Writes
In order to keep two datastores in sync, one could perform a dual write, which is executing a write to one datastore following a second write to the other. The first write can be retried, and the second can be aborted should the first fail after exhausting retries. However, the two datastores can get out of sync if the write to the second datastore fails. A common solution is to build a repair routine, which can periodically re-apply data from the first to the second store, or does so only if differences are detected.
Issues: Implementing the repair routine typically is tailored work which may not be reusable. Also, data between the stores remain out of sync until the repair routine is applied. The solution can become increasingly complicated if more than two datastores are involved. Finally, the repair routine can add substantial stress to the primary data source during its activity.
Change Log Table
When mutations (like an insert, update and delete) occur on a set of tables, entries for the changes are added to the log table as part of the same transaction. Another thread or process is constantly polling events from the log table and writes them to one or multiple datastores, optionally removing events from the log table after acknowledged by all datastores.
Issues: This needs to be implemented as a library and ideally without requiring code changes for the application using it. In a polyglot environment this library implementation needs to be repeated for each supported language and it is challenging to ensure consistent features and behavior across languages.
Another issue exists for the capture of schema changes, where some systems, like MySQL, don’t support transactional schema changes [1][2]. Therefore, the pattern to execute a change (like a schema change) and to transactionally write it to the change log table does not always work.
Distributed Transactions
Distributed transactions can be used to span a transaction across multiple heterogeneous datastores so that a write operation is either committed to all involved stores or to none.
Issues: Distributed transactions have proven to be problematic across heterogeneous datastores. By their nature, they can only rely on the lowest common denominator of participating systems. For example, XA transactions block execution if the application process fails during the prepare phase; moreover, XA provides no deadlock detection and no support for optimistic concurrency-control schemes. Also, certain systems like ElasticSearch, do not support XA or any other heterogeneous transaction model. Thus, ensuring the atomicity of writes across different storage technologies remains a challenging problem for applications [3].
Delta
Delta has been developed to address the limitations of existing solutions for data synchronization, and also allows to enrich data on the fly. Our goal was to abstract those complexities from application developers so they can focus on implementing business features. In the following, we are describing “Movie Search”, an actual use case within Netflix that leverages Delta.
In Netflix the microservice architecture is widely adopted and each microservice typically handles only one type of data. The core movie data resides in a microservice called Movie Service, and related data such as movie deals, talents, vendors and so on are managed by multiple other microservices (e.g Deal Service, Talent Service and Vendor Service). Business users in Netflix Studios often need to search by various criteria for movies in order to keep track of productions, therefore, it is crucial for them to be able to search across all data that are related to movies.
Prior to Delta, the movie search team had to fetch data from multiple other microservices before indexing the movie data. Moreover, the team had to build a system that periodically updated their search index by querying others for changes, even if there was no change at all. That system quickly grew very complex and became difficult to maintain.
Figure 1. Polling System Prior to Delta
After on-boarding to Delta, the system is simplified into an event driven system, as depicted in the following diagram. CDC (Change-Data-Capture) events are sent by the Delta-Connector to a Keystone Kafka topic. A Delta application built using the Delta Stream Processing Framework consumes the CDC events from the topic, enriches each of them by calling other microservices, and finally sinks the enriched data to the search index in Elasticsearch. The whole process is nearly real-time, meaning as soon as the changes are committed to the datastore, the search indexes are updated.
Figure 2. Data Pipeline using Delta
In the following sections, we are going to describe the Delta-Connector that connects to a datastore and publishes CDC events to the Transport Layer, which is a real-time data transportation infrastructure routing CDC events to Kafka topics. And lastly we are going to describe the Delta Stream Processing Framework that application developers can use to build their data processing and enrichment logics.
CDC (Change-Data-Capture)
We have developed a CDC service named Delta-Connector, which is able to capture committed changes from a datastore in real-time and write them to a stream. Real-time changes are captured from the datastore’s transaction log and dumps. Dumps are taken because transaction logs typically do not contain the full history of changes. Changes are commonly serialized as Delta events so that a consumer does not need to be concerned if a change originates from the transaction log or a dump.
Delta-Connector offers multiple advanced features such as:
Ability to write into custom outputs beyond Kafka.
Ability to trigger manual dumps at any time, for all tables, a specific table, or for specific primary keys.
Dumps can be taken in chunks, so that there is no need to repeat from scratch in case of failure.
No need to acquire locks on tables, which is essential to ensure that the write traffic on the database is never blocked by our service.
High availability, via standby instances across AWS Availability Zones.
We currently support MySQL and Postgres, including when deployed in AWS RDS and its Aurora flavor. In addition, we support Cassandra (multi-master). We will cover the Delta-Connector in more detail in upcoming blog posts.
Kafka & Transport Layer
The transport layer of Delta events were built on top of the Messaging Service in our Keystone platform.
Historically, message publishing at Netflix is optimized for availability instead of durability (see a previous blog). The tradeoff is potential broker data inconsistencies in various edge scenarios. For example, unclean leader election will result in consumer to potentially duplicate or lose events.
For Delta, we want stronger durability guarantees in order to make sure CDC events can be guaranteed to arrive to derived stores. To enable this, we offered special purpose built Kafka cluster as a first class citizen. Some broker configuration looks like below.
In Keystone Kafka clusters, unclean leader election is usually enabled to favor producer availability. This can result in messages being lost when an out-of-sync replica is elected as a leader. For the new high durability Kafka cluster, unclean leader election is disabled to prevent these messages getting lost.
We’ve also increased the replication factor from 2 to 3 and the minimum insync replicas from 1 to 2. Producers writing to this cluster require acks from all, to guarantee that 2 out of 3 replicas have the latest messages that were written by the producers.
When a broker instance gets terminated, a new instance replaces the terminated broker. However, this new broker will need to catch up on out-of-sync replicas, which may take hours. To improve the recovery time for this scenario, we started using block storage volumes (Amazon Elastic Block Store) instead of local disks on the brokers. When a new instance replaces the terminated broker, it now attaches the EBS volume that the terminated instance had and starts catching up on new messages. This process reduces the catch up time from hours to minutes since the new instance no longer have to replicate from a blank state. In general, the separate life cycles of storage and broker greatly reduce the impact of broker replacement.
To further maximize our delivery guarantee, we used the message tracing system to detect any message loss due to extreme conditions (e.g clock drift on the partition leader).
Stream Processing Framework
The processing layer of Delta is built on top of Netflix SPaaS platform, which provides Apache Flink integration with the Netflix ecosystem. The platform provides a self-service UI which manages Flink job deployments and Flink cluster orchestration on top of our container management platform Titus. The self-service UI also manages job configurations and allows users to make dynamic configuration changes without having to recompile the Flink job.
Delta provides a stream processing framework on top of Flink and SPaaS that uses an annotation driven DSL (Domain Specific Language) to abstract technical details further away. For example, to define a step that enriches events by calling external services, users only need to write the following DSL and the framework will translate it into a model which is executed by Flink.
Figure 3. Enrichment DSL Example in a Delta Application
The processing framework not only reduces the learning curve, but also provides common stream processing functionalities like deduplication, schematization, as well as resilience and fault tolerance to address general operational concerns.
Delta Stream Processing Framework consists of two key modules, the DSL & API module and Runtime module. The DSL & API module provides the annotation based DSL and UDF (User-Defined-Function) APIs for users to write custom processing logic (e.g filter and transformation). The Runtime module provides DSL parser implementation that builds an internal representation of the processing steps in DAG models. The Execution component interprets the DAG models to initialize the actual Flink operators and eventually run the Flink app. The architecture of the framework is illustrated in the following Chart.
Users can focus on their business logic without the need of learning the specifics of Flink or the SPaaS framework.
Optimization can be made in a way that is transparent to users, and bugs can be fixed without requiring any changes to user code (UDFs).
Operating Delta applications is made simple for users as the framework provides resilience and failure tolerance out of the box and collects many granular metrics that can be used for alerts.
Production Usages
Delta has been running in production for over a year and has been playing a crucial role in many Netflix Studio applications. It has helped teams implement use cases such as search indexing, data warehousing, and event driven workflows. Below is a view of the high level architecture of the Delta platform.
Figure 5. High Level Architecture of Delta
Stay Tuned
We will publish follow-up blogs about technical details of the key components such as Delta-Connector and Delta Stream Processing Framework. Please stay tuned. Also feel free to reach out to the authors for any questions you may have.
In a microservice architecture such as Netflix’s, propagating datasets from a single source to multiple downstream destinations can be challenging. These datasets can represent anything from service configuration to the results of a batch job, are often needed in-memory to optimize access and must be updated as they change over time.
One example displaying the need for dataset propagation: at any given time Netflix runs a very large number of A/B tests. These tests span multiple services and teams, and the operators of the tests need to be able to tweak their configuration on the fly. There needs to be the ability to detect nodes that have failed to pick up the latest test configuration, and the ability to revert to older versions of configuration when things go wrong.
Another example of a dataset that needs to be disseminated is the result of a machine-learning model: the results of these models may be used by several teams, but the ML teams behind the model aren’t necessarily interested in maintaining high-availability services in the critical path. Rather than each team interested in consuming the model having to build in fallbacks to degrade gracefully, there is a lot of value in centralizing the work to allow multiple teams to leverage a single team’s effort.
Without infrastructure-level support, every team ends up building their own point solution to varying degrees of success. Datasets themselves are of varying size, from a few bytes to multiple gigabytes. It is important to build in observability and fault detection, and to provide tooling to allow operators to make quick changes without having to develop their own tools.
Dataset propagation
At Netflix we use an in-house dataset pub/sub system called Gutenberg. Gutenberg allows for propagating versioned datasets — consumers subscribe to data and are updated to the latest versions when they are published. Each version of the dataset is immutable and represents a complete view of the data — there is no dependency on previous versions of data. Gutenberg allows browsing older versions of data for use cases such as debugging, rapid mitigation of data related incidents, and re-training of machine-learning models. This post is a high level overview of the design and architecture of Gutenberg.
Data model
1 topic -> many versions
The top-level construct in Gutenberg is a “topic”. A publisher publishes to a topic and consumers consume from a topic. Publishing to a topic creates a new monotonically-increasing “version”. Topics have a retention policy that specifies a number of versions or a number of days of versions, depending on the use case. For example, you could configure a topic to retain 10 versions or 10 days of versions.
Each version contains metadata (keys and values) and a data pointer. You can think of a data pointer as special metadata that points to where the actual data you published is stored. Today, Gutenberg supports direct data pointers (where the payload is encoded in the data pointer value itself) and S3 data pointers (where the payload is stored in S3). Direct data pointers are generally used when the data is small (under 1MB) while S3 is used as a backing store when the data is large.
1 topic -> many publish scopes
Gutenberg provides the ability to scope publishes to a particular set of consumers — for example by region, application, or cluster. This can be used to canary data changes with a single cluster, roll changes out incrementally, or constrain a dataset so that only a subset of applications can subscribe to it. Publishers decide the scope of a particular data version publish, and they can later add scopes to a previously published version. Note that this means that the concept of a latest version depends on the scope — two applications may see different versions of data as the latest depending on the publish scopes created by the publisher. The Gutenberg service matches the consuming application with the published scopes before deciding what to advertise as the latest version.
Use cases
The most common use case of Gutenberg is to propagate varied sizes of data from a single publisher to multiple consumers. Often the data is held in memory by consumers and used as a “total cache”, where it is accessed at runtime by client code and atomically swapped out under the hood. Many of these use cases can be loosely grouped as “configuration” — for example Open Connect Appliance cache configuration, supported device type IDs, supported payment method metadata, and A/B test configuration. Gutenberg provides an abstraction between the publishing and consumption of this data — this allows publishers the freedom to iterate on their application without affecting downstream consumers. In some cases, publishing is done via a Gutenberg-managed UI, and teams do not need to manage their own publishing app at all.
Another use case for Gutenberg is as a versioned data store. This is common for machine-learning applications, where teams build and train models based on historical data, see how it performs over time, then tweak some parameters and run through the process again. More generally, batch-computation jobs commonly use Gutenberg to store and propagate the results of a computation as distinct versions of datasets. “Online” use cases subscribe to topics to serve real-time requests using the latest versions of topics’ data, while “offline” systems may instead use historical data from the same topics — for example to train machine-learned models.
An important point to note is that Gutenberg is not designed as an eventing system — it is meant purely for data versioning and propagation. In particular, rapid-fire publishes do not result in subscribed clients stepping through each version; when they ask for an update, they will be provided with the latest version, even if they are currently many versions behind. Traditional pub-sub or eventing systems are suited towards messages that are smaller in size and are consumed in sequence; consumers may build up a view of an entire dataset by consuming an entire (potentially compacted) feed of events. Gutenberg, however, is designed for publishing and consuming an entire immutable view of a dataset.
Design and architecture
Gutenberg consists of a service with gRPC and REST APIs as well as a Java client library that uses the gRPC API.
High-level architecture
Client
The Gutenberg client library handles tasks such as subscription management, S3 uploads/downloads, Atlas metrics, and knobs you can tweak using Archaius properties. It communicates with the Gutenberg service via gRPC, using Eureka for service discovery.
Publishing
Publishers generally use high-level APIs to publish strings, files, or byte arrays. Depending on the data size, the data may be published as a direct data pointer or it may get uploaded to S3 and then published as an S3 data pointer. The client can upload a payload to S3 on the caller’s behalf or it can publish just the metadata for a payload that already exists in S3.
Direct data pointers are automatically replicated globally. Data that is published to S3 is uploaded to multiple regions by the publisher by default, although that can be configured by the caller.
Subscription management
The client library provides subscription management for consumers. This allows users to create subscriptions to particular topics, where the library retrieves data (eg from S3) before handing off to a user-provided listener. Subscriptions operate on a polling model — they ask the service for a new update every 30 seconds, providing the version with which they were last notified. Subscribed clients will never consume an older version of data than the one they are on unless they are pinned (see “Data resiliency” below). Retry logic is baked in and configurable — for instance, users can configure Gutenberg to try older versions of data if it fails to download or process the latest version of data on startup, often to deal with non-backwards-compatible data changes. Gutenberg also provides a pre-built subscription that holds on to the latest data and atomically swaps it out under the hood when a change comes in — this tackles a majority of subscription use cases, where callers only care about the current value at any given time. It allows callers to specify a default value — either for a topic that has never been published to (a good fit when the topic is used for configuration) or if there is an error consuming the topic (to avoid blocking service startup when there is a reasonable default).
Consumption APIs
Gutenberg also provides high-level client APIs that wrap the low-level gRPC APIs and provide additional functionality and observability. One example of this is to download data for a given topic and version — this is used extensively by components plugged into Netflix Hollow. Another example is a method to get the “latest” version of a topic at a particular time — a common use case when debugging and when training ML models.
Client resiliency and observability
Gutenberg was designed with a bias towards allowing consuming services to be able to start up successfully versus guaranteeing that they start with the freshest data. With this in mind, the client library was built with fallback logic for when it cannot communicate with the Gutenberg service. After HTTP request retries are exhausted, the client downloads a fallback cache of topic publish metadata from S3 and works based off of that. This cache contains all the information needed to decide whether an update needs to be applied, and from where data needs to be fetched (either from the publish metadata itself or from S3). This allows clients to fetch data (which is potentially stale, depending on how current that fallback cache is) without using the service.
Part of the benefit of providing a client library is the ability to expose metrics that can be used to alert on an infrastructure-wide issue or issues with specific applications. Today these metrics are used by the Gutenberg team to monitor our publish-propagation SLI and to alert in the event of widespread issues. Some clients also use these metrics to alert on app-specific errors, for example individual publish failures or a failure to consume a particular topic.
Server
The Gutenberg service is a Governator/Tomcat application that exposes gRPC and REST endpoints. It uses a globally-replicated Cassandra cluster for persistence and to propagate publish metadata to every region. Instances handling consumer requests are scaled separately from those handling publish requests — there are approximately 1000 times more consumer requests than there are publish requests. In addition, this insulates publishing from consumption — a sudden spike in publishing will not affect consumption, and vice versa.
Each instance in the consumer request cluster maintains its own in-memory cache of “latest publishes”, refreshing it from Cassandra every few seconds. This is to handle the large volume of poll requests coming from subscribed clients without passing on the traffic to the Cassandra cluster. In addition, request-pooling low-ttl caches protect against large spikes in requests that could potentially burden Cassandra enough to affect entire region — we’ve had situations where transient errors coinciding with redeployments of large clusters have caused Gutenberg service degradation. Furthermore, we use an adaptive concurrency limiter bucketed by source application to throttle misbehaving applications without affecting others.
For cases where the data was published to S3 buckets in multiple regions, the server makes a decision on what bucket to send back to the client to download from based on where the client is. This also allows the service to provide the client with a bucket in the “closest” region, and to have clients fall back to another region if there is a region outage.
Before returning subscription data to consumers, the Gutenberg service first runs consistency checks on the data. If the checks fail and the polling client already has consumed some data the service returns nothing, which effectively means that there is no update available. If the polling client has not yet consumed any data (this usually means it has just started up), the service queries the history for the topic and returns the latest value that passes consistency checks. This is because we see sporadic replication delays at the Cassandra layer, where by the time a client polls for new data, the metadata associated with the most recently published version has only been partially replicated. This can result in incomplete data being returned to the client, which then manifests itself either as a data fetch failure or an obscure business-logic failure. Running these consistency checks on the server insulates consumers from the eventual-consistency caveats that come with the service’s choice of a data store.
Visibility on topic publishes and nodes that consume a topic’s data is important for auditing and to gather usage info. To collect this data, the service intercepts requests from publishers and consumers (both subscription poll requests and others) and indexes them in Elasticsearch by way of the Keystone data pipeline. This allows us to gain visibility into topic usage and decommission topics that are no longer in use. We expose deep-links into a Kibana dashboard from an internal UI to allow topic owners to get a handle on their consumers in a self-serve manner.
In addition to the clusters serving publisher and consumer requests, the Gutenberg service runs another cluster that runs periodic tasks. Specifically this runs two tasks:
Every few minutes, all the latest publishes and metadata are gathered up and sent to S3. This powers the fallback cache used by the client as detailed above.
A nightly janitor job purges topic versions which exceed their topic’s retention policy. This deletes the underlying data as well (e.g. S3 objects) and helps enforce a well-defined lifecycle for data.
Data resiliency
Pinning
In the world of application development bad deployments happen, and a common mitigation strategy there is to roll back the deployment. A data-driven architecture makes that tricky, since behavior is driven by data that changes over time.
Data propagated by Gutenberg influences — and in many cases drives — system behavior. This means that when things go wrong, we need a way to roll back to a last-known good version of data. To facilitate this, Gutenberg provides the ability to “pin” a topic to a particular version. Pins override the latest version of data and force clients to update to that version — this allows for quick mitigation rather than having an under-pressure operator attempt to figure out how to publish the last known good version. You can even apply a pin to a specific publish scope so that only consumers that match that scope are pinned. Pins also override data that is published while the pin is active, but when the pin is removed clients update to the latest version, which may be the latest version when the pin was applied or a version published while the pin was active.
Incremental rollout
When deploying new code, it’s often a good idea to canary new builds with a subset of traffic, roll it out incrementally, or otherwise de-risk a deployment by taking it slow. For cases where data drives behavior, a similar principle should be applied.
One feature Gutenberg provides is the ability to incrementally roll out data publishes via Spinnaker pipelines. For a particular topic, users configure what publish scopes they want their publish to go to and what the delay is between each one. Publishing to that topic then kicks off the pipeline, which publishes the same data version to each scope incrementally. Users are able to interact with the pipeline; for example they may choose to pause or cancel pipeline execution if their application starts misbehaving, or they may choose to fast-track a publish to get it out sooner. For example, for some topics we roll out a new dataset version one AWS region at a time.
Scale
Gutenberg has been at use at Netflix for the past three years. At present, Gutenberg stores low tens-of-thousands of topics in production, about a quarter of which have published at least once in the last six months. Topics are published at a variety of cadences — from tens of times a minute to once every few months — and on average we see around 1–2 publishes per second, with peaks and troughs about 12 hours apart.
In a given 24 hour period, the number of nodes that are subscribed to at least one topic is in the low six figures. The largest number of topics a single one of these nodes is subscribed to is north of 200, while the median is 7. In addition to subscribed applications, there are a large number of applications that request specific versions of specific topics, for example for ML and Hollow use cases. Currently the number of nodes that make a non-subscribe request for a topic is in the low hundreds of thousands, the largest number of topics requested is 60, and the median is 4.
Future work
Here’s a sample of work we have planned for Gutenberg:
Polyglot support: today Gutenberg only supports a Java client, but we’re seeing an increasing number of requests for Node.js and Python support. Some of these teams have cobbled together their own solutions built on top of the Gutenberg REST API or other systems. Rather than have different teams reinvent the wheel, we plan to provide first-class client libraries for Node.js and Python.
Encryption and access control: for sensitive data, Gutenberg publishers should be able to encrypt data and distribute decryption credentials to consumers out-of-band. Adding this feature opens Gutenberg up to another set of use-cases.
Better incremental rollout: the current implementation is in its pretty early days and needs a lot of work to support customization to fit a variety of use cases. For example, users should be able to customize the rollout pipeline to automatically accept or reject a data version based on their own tests.
Alert templates: the metrics exposed by the Gutenberg client are used by the Gutenberg team and a few teams that are power users. Instead, we plan to provide leverage to users by building and parameterizing templates they can use to set up alerts for themselves.
Topic cleanup: currently topics sit around forever unless they are explicitly deleted, even if no one is publishing to them or consuming from them. We plan on building an automated topic cleanup system based on the consumption trends indexed in Elasticsearch.
Data catalog integration: an ongoing issue at Netflix is the problem of cataloging data characteristics and lineage. There is an effort underway to centralize metadata around data sources and sinks, and once Gutenberg integrates with this, we can leverage the catalog to automate tools that message the owners of a dataset.
If any of this piques your interest — we’re hiring!
Infrastructure for Contextual Bandits and Reinforcement Learning — theme of the ML Platform meetup hosted at Netflix, Los Gatos on Sep 12, 2019.
Contextual and Multi-armed Bandits enable faster and adaptive alternatives to traditional A/B Testing. They enable rapid learning and better decision-making for product rollouts. Broadly speaking, these approaches can be seen as a stepping stone to full-on Reinforcement Learning (RL) with closed-loop, on-policy evaluation and model objectives tied to reward functions. At Netflix, we are running several such experiments. For example, one set of experiments is focussed on personalizing our artwork assets to quickly select and leverage the “winning” images for a title we recommend to our members.
As with other traditional machine learning and deep learning paths, a lot of what the core algorithms can do depends upon the support they get from the surrounding infrastructure and the tooling that the ML platform provides. Given the infrastructure space for RL approaches is still relatively nascent, we wanted to understand what others in the community are doing in this space.
This was the motivation for the meetup’s theme. It featured three relevant talks from LinkedIn, Netflix and Facebook, and a platform architecture overview talk from first time participant Dropbox.
After a brief introduction on the theme and motivation of its choice, the talks were kicked off by Kinjal Basu from LinkedIn who talked about Online Parameter Selection for Web-Based Ranking via Bayesian Optimization. In this talk, Kinjal used the example of the LinkedIn Feed, to demonstrate how they use bandit algorithms to solve for the optimal parameter selection problem efficiently.
He started by laying out some of the challenges around inefficiencies of engineering time when manually optimizing for weights/parameters in their business objective functions. The key insight was that by assuming a latent Gaussian Process (GP) prior on the key business metric actions like viral engagement, job applications, etc., they were able to reframe the problem as a straight-forward black-box optimization problem. This allowed them to use BayesOpt techniques to solve this problem.
The algorithm used to solve this reformulated optimization problem is a popular E/E technique known as Thompson Sampling. He talked about the infrastructure used to implement this. They have built an offline BayesOpt library, a parameter store to retrieve the right set of parameters, and an online serving layer to score the objective at serving time given the parameter distribution for a particular member.
He also described some practical considerations, like member-parameter stickiness, to avoid per session variance in a member’s experience. Their offline parameter distribution is recomputed hourly, so the member experience remains consistent within the hour. Some simulation results and some online A/B test results were shared, demonstrating substantial lifts in the primary business metrics, while keeping the secondary metrics above preset guardrails.
He concluded by stressing the efficiency their teams had achieved by doing online parameter exploration instead of the much slower human-in-the-loop manual explorations. In the future, they plan to explore adding new algorithms like UCB, considering formulating the problem as a grey-box optimization problem, and switching between the various business metrics to identify which is the optimal metric to optimize.
The second talk was by Netflix on our Bandit Infrastructure built for personalization use cases. Fernando Amat and Elliot Chow jointly gave this talk.
Fernando started the first part of the talk and described the core recommendation problem of identifying the top few titles in a large catalog that will maximize the probability of play. Using the example of evidence personalization — images, text, trailers, synopsis, all assets that come together to add meaning to a title — he described how the problem is essentially a slate recommendation task and is well suited to be solved using a Bandit framework.
If such a framework is to be generic, it must support different contexts, attributions and reward functions. He described a simple Policy API that models the Slate tasks. This API supports the selection of a state given a list of options using the appropriate algorithm and a way to quantify the propensities, so the data can be de-biased. Fernando ended his part by highlighting some of the Bandit Metrics they implemented for offline policy evaluation, like Inverse Propensity Scoring (IPS), Doubly Robust (DR), and Direct Method (DM).
For Bandits, where attribution is a critical part of the equation, it’s imperative to have a flexible and robust data infrastructure. Elliot started the second part of the talk by describing the real-time framework they have built to bring together all signals in one place making them accessible through a queryable API. These signals include member activity data (login, search, playback), intent-to-treat (what title/assets the system wants to impress to the member) and the treatment (impressions of images, trailers) that actually made it to the member’s device.
Elliot talked about what is involved in “Closing the loop”. First, the intent-to-treat needs to be joined with the treatment logging along the way, the policies in effect, the features used and the various propensities. Next, the reward function needs to be updated, in near real time, on every logged action (like a playback) for both short-term and long-term rewards. And finally each new observation needs to update the policy, compute offline policy evaluation metrics and then push the policy back to production so it can generate new intents to treat.
To be able to support this, the team had to standardize on several infrastructure components. Elliot talked about the three key components — a) Standardized Logging from the treatment services, b) Real-time stream processing over Apache Flink for member activity joins, and c) an Apache Spark client for attribution and reward computation. The team has also developed a few common attribution datasets as “out-of-the-box” entities to be used by the consuming teams.
Finally, Elliot ended by talking about some of the challenges in building this Bandit framework. In particular, he talked about the misattribution potential in a complex microservice architecture where often intermediary results are cached. He also talked about common pitfalls of stream-processed data like out of order processing.
This framework has been in production for almost a year now and has been used to support several A/B tests across different recommendation use cases at Netflix.
After a short break, the second session started with a talk from Facebook focussed on practical solutions to exploration problems. Sam Daulton described how the infrastructure and product use cases came along. He described how the adaptive experimentation efforts are aimed at enabling fast experimentation with a goal of adding varying degrees of automation for experts using the platform in an ad hoc fashion all the way to no-human-in-the-loop efforts.
He dived into a policy search problem they tried to solve: How many posts to load for a user depending upon their device’s connection quality. They modeled the problem as an infinite-arm bandit problem and used Gaussian Process (GP) regression. They used Bayesian Optimization to perform multi-metric optimization — e.g., jointly optimizing decrease in CPU utilization along with increase in user engagement. One of the challenges he described was how to efficiently choose a decision point, when the joint optimization search presented a Pareto frontier in the possible solution space. They used constraints on individual metrics in the face of noisy experiments to allow business decision makers to arrive at an optimal decision point.
Not all spaces can be efficiently explored online, so several research teams at Facebook use Simulations offline. For example, a ranking team would ingest live user traffic and subject it to a number of ranking configurations and simulate the event outcomes using predictive models running on canary rankers. The simulations were often biased and needed de-biasing (using multi-task GP regression) for them to be used alongside online results. They observed that by combining their online results with de-biased simulation results they were able to substantially improve their model fit.
To support these efforts, they developed and open sourced some tools along the way. Sam described Ax and BoTorch — Ax is a library for managing adaptive experiments and BoTorch is a library for Bayesian Optimization research. There are many applications already in production for these tools from both basic hyperparameter exploration to more involved AutoML use cases.
The final section of Sam’s talk focussed on Constrained Bayesian Contextual Bandits. They described the problem of video uploads to Facebook where the goal is to maximize the quality of the video without a decrease in reliability of the upload. They modeled it as a Thompson Sampling optimization problem using a Bayesian Linear model. To enforce the constraints, they used a modified algorithm, Constrained Thompson Sampling, to ensure a non-negative change in reliability. The reward function also similarly needed some shaping to align with the constrained objective. With this reward shaping optimization, Sam shared some results that showed how the Constrained Thompson Sampling algorithm surfaced many actions that satisfied the reliability constraints, where vanilla Thompson Sampling had failed.
The last talk of the event was a system architecture introduction by Dropbox’s Tsahi Glik. As a first time participant, their talk was more of an architecture overview of the ML Infra in place at Dropbox.
Tsahi started off by giving some ML usage examples at Dropbox like Smart Sync which predicts which file you will use on a particular device, so it’s preloaded. Some of the challenges he called out were the diversity and size of the disparate data sources that Dropbox has to manage. Data privacy is increasingly important and presents its own set of challenges. From an ML practice perspective, they also have to deal with a wide variety of development processes and ML frameworks, custom work for new use cases and challenges with reproducibility of training.
He shared a high level overview of their ML platform showing the various common stages of developing and deploying a model categorized by the online and offline components. He then dived into some individual components of the platform.
The first component he talked about was a user activity service to collect the input signals for the models. This service, Antenna, provides a way to query user activity events and summarizes the activity with various aggregations. The next component he dived deeper into was a content ingestion pipeline for OCR (optical character recognition). As an example, he explained how the image of a receipt is converted into contextual text. The pipeline takes the image through multiple models for various subtasks. The first classifies whether the image has some detectable text, the second does corner detection, the third does word box detection followed by deep LSTM neural net that does the core sequence based OCR. The final stage performs some lexicographical post processing.
He talked about the practical considerations of ingesting user content — they need to prevent malicious content from impacting the service. To enable this they have adopted a plugin based architecture and each task plugin runs in a sandbox jail environment.
Their offline data preparation ETLs run on Spark and they use Airflow as the orchestration layer. Their training infrastructure relies on a hybrid cloud approach. They have built a layer and command line tool called dxblearn that abstracts the training paths, allowing the researchers to train either locally or leverage AWS. dxblearn also allows them to fire off training jobs for hyperparameter tuning.
Published models are sent to a model store in S3 which are then picked up by their central model prediction service that does online inferencing for all use cases. Using a central inferencing service allows them to partition compute resources appropriately and having a standard API makes it easy to share and also run inferencing in the cloud.
They have also built a common “suggest backend” that is a generic predictive application that can be used by the various edge and production facing services that regularizes the data fetching, prediction and experiment configuration needed for a product prediction use case. This allows them to do live experimentation more easily.
The last part of Tsahi’s talk described a product use case leveraging their ML Platform. He used the example of a promotion campaign ranker, (eg “Try Dropbox business”) for up-selling. This is modeled as a multi-armed bandit problem, an example well in line with the meetup theme.
The biggest value of such meetups lies in the high bandwidth exchange of ideas from like-minded practitioners. In addition to some great questions after the talks, the 150+ attendees stayed well past 2 hours in the reception exchanging stories and lessons learnt solving similar problems at scale.
In the Personalization org at Netflix, we are always interested in exchanging ideas about this rapidly evolving ML space in general and the bandits and reinforcement learning space in particular. We are committed to sharing our learnings with the community and hope to discuss progress here, especially our work on Policy Evaluation and Bandit Metrics in future meetups. If you are interested in working on this exciting space, there are many open opportunities on both engineering and research endeavors.
Open Sourcing Mantis: A Platform For Building Cost-Effective, Realtime, Operations-Focused Applications
By Jeff Chao on behalf of the Mantis team
Today we’re excited to announce that we’re open sourcing Mantis, a platform that helps Netflix engineers better understand the behavior of their applications to ensure the highest quality experience for our members. We believe the challenges we face here at Netflix are not necessarily unique to Netflix which is why we’re sharing it with the broader community.
As a streaming microservices ecosystem, the Mantis platform provides engineers with capabilities to minimize the costs of observing and operating complex distributed systems without compromising on operational insights. Engineers have built cost-efficient applications on top of Mantis to quickly identify issues, trigger alerts, and apply remediations to minimize or completely avoid downtime to the Netflix service. Where other systems may take over ten minutes to process metrics accurately, Mantis reduces that from tens of minutes down to seconds, effectively reducing our Mean-Time-To-Detect. This is crucial because any amount of downtime is brutal and comes with an incredibly high impact to our members — every second counts during an outage.
As the company continues to grow our member base, and as those members use the Netflix service even more, having cost-efficient, rapid, and precise insights into the operational health of our systems is only growing in importance. For example, a five-minute outage today is equivalent to a two-hour outage at the time of our last Mantis blog post.
Mantis Makes It Easy to Answer New Questions
The traditional way of working with metrics and logs alone is not sufficient for large-scale and growing systems. Metrics and logs require that you to know what you want to answer ahead of time. Mantis on the other hand allows us to sidestep this drawback completely by giving us the ability to answer new questions without having to add new instrumentation. Instead of logs or metrics, Mantis enables a democratization of events where developers can tap into an event stream from any instrumented application on demand. By making consumption on-demand, you’re able to freely publish all of your data to Mantis.
Mantis is Cost-Effective in Answering Questions
Publishing 100% of your operational data so that you’re able to answer new questions in the future is traditionally cost prohibitive at scale. Mantis uses an on-demand, reactive model where you don’t pay the cost for these events until something is subscribed to their stream. To further reduce cost, Mantis reissues the same data for equivalent subscribers. In this way, Mantis is differentiated from other systems by allowing us to achieve streaming-based observability on events while empowering engineers with the tooling to reduce costs that would otherwise become detrimental to the business.
From the beginning, we’ve built Mantis with this exact guiding principle in mind: Let’s make sure we minimize the costs of observing and operating our systems without compromising on required and opportunistic insights.
Guiding Principles Behind Building Mantis
The following are the guiding principles behind building Mantis.
We should have access to raw events. Applications that publish events into Mantis should be free to publish every single event. If we prematurely transform events at this stage, then we’re already at a disadvantage when it comes to getting insight since data in its original form is already lost.
We should be able to access these events in realtime. Operational use cases are inherently time sensitive by nature. The traditional method of publishing, storing, and then aggregating events in batch is too slow. Instead, we should process and serve events one at a time as they arrive. This becomes increasingly important with scale as the impact becomes much larger in far less time.
We should be able to ask new questions of this data without having to add new instrumentation to your applications. It’s not possible to know ahead of time every single possible failure mode our systems might encounter despite all the rigor built in to make these systems resilient. When these failures do inevitably occur, it’s important that we can derive new insights with this data. You should be able to publish as large of an event with as much context as you want. That way, when you think of a new questions to ask of your systems in the future, the data will be available for you to answer those questions.
We should be able to do all of the above in a cost-effective way. As our business critical systems scale, we need to make sure the systems in support of these business critical systems don’t end up costing more than the business critical systems themselves.
With these guiding principles in mind, let’s take a look at how Mantis brings value to Netflix.
How Mantis Brings Value to Netflix
Mantis has been in production for over four years. Over this period several critical operational insight applications have been built on top of the Mantis platform.
A few noteworthy examples include:
Realtime monitoring of Netflix streaming health which examines all of Netflix’s streaming video traffic in realtime and accurately identifies negative impact on the viewing experience with fine-grained granularity. This system serves as an early warning indicator of the overall health of the Netflix service and will trigger and alert relevant teams within seconds.
Contextual Alerting which analyzes millions of interactions between dozens of Netflix microservices in realtime to identify anomalies and provide operators with rich and relevant context. The realtime nature of these Mantis-backed aggregations allows the Mean-Time-To-Detect to be cut down from tens of minutes to a few seconds. Given the scale of Netflix this makes a huge impact.
Raven which allows users to perform ad-hoc exploration of realtime data from hundreds of streaming sources using our Mantis Query Language (MQL).
Cassandra Health check which analyzes rich operational events in realtime to generate a holistic picture of the health of every Cassandra cluster at Netflix.
Alerting on Log data which detects application errors by processing data from thousands of Netflix servers in realtime.
Chaos Experimentation monitoring which tracks user experience during a Chaos exercise in realtime and triggers an abort of the chaos exercise in case of an adverse impact.
Realtime Personally Identifiable Information (PII) data detection samples data across all streaming sources to quickly identify transmission of sensitive data.
A lot of work has gone into making Mantis successful at Netflix. We’d like to thank all the contributors, in alphabetical order by first name, that have been involved with Mantis at various points of its existence:
Andrei Ushakov, Ben Christensen, Ben Schmaus, Chris Carey, Cody Rioux, Daniel Jacobson, Danny Yuan, Erik Meijer, Indrajit Roy Choudhury, Jeff Chao, Josh Evans, Justin Becker, Kathrin Probst, Kevin Lew, Neeraj Joshi, Nick Mahilani, Piyush Goyal, Prashanth Ramdas, Ram Vaithalingam, Ranjit Mavinkurve, Sangeeta Narayanan, Santosh Kalidindi, Seth Katz, Sharma Podila, Zhenzhong Xu.
We are pleased to announce the open-source launch of Polynote: a new, polyglot notebook with first-class Scala support, Apache Spark integration, multi-language interoperability including Scala, Python, and SQL, as-you-type autocomplete, and more.
Polynote provides data scientists and machine learning researchers with a notebook environment that allows them the freedom to seamlessly integrate our JVM-based ML platform — which makes heavy use of Scala — with the Python ecosystem’s popular machine learning and visualization libraries. It has seen substantial adoption among Netflix’s personalization and recommendation teams, and it is now being integrated with the rest of our research platform.
At Netflix, we have always felt strongly about sharing with the open source community, and believe that Polynote has a great potential to address similar needs outside of Netflix.
Feature Overview
Reproducibility
Polynote promotes notebook reproducibility by design. By taking a cell’s position in the notebook into account when executing it, Polynote helps prevent bad practices that make notebooks difficult to re-run from the top.
Editing Improvements
Polynote provides IDE-like features such as interactive autocomplete and parameter hints, in-line error highlighting, and a rich text editor with LaTeX support.
Visibility
The Polynote UI provides at-a-glance insights into the state of the kernel by showing kernel status, highlighting currently-running cell code, and showing currently executing tasks.
Polyglot
Each cell in a notebook can be written in a different language with variables shared between them. Currently Scala, Python, and SQL cell types are supported.
Dependency and Configuration Management
Polynote provides configuration and dependency setup saved within the notebook itself, and helps solve some of the dependency problems commonly experienced by Spark developers.
Data Visualization
Native data exploration and visualization helps users learn more about their data without cluttering their notebooks. Integration with matplotlib and Vega allows power users to communicate with others through beautiful visualizations
Reimagining the Scala notebook experience
On the Netflix Personalization Infrastructure team, our job is to accelerate machine learning innovation by building tools that can remove pain points and allow researchers to focus on research. Polynote originated from a frustration with the shortcomings of existing notebook tools, especially with respect to their support of Scala.
For example, while Python developers are used to working inside an environment constructed using a package manager with a relatively small number of dependencies, Scala developers typically work in a project-based environment with a build tool managing hundreds of (often) conflicting dependencies. With Spark, developers are working in a cluster computing environment where it is imperative that their distributed code runs in a consistent environment no matter which node is being used. Finally, we found that our users were also frustrated with the code editing experience within notebooks, especially those accustomed to using IntelliJ IDEA or Eclipse.
Some problems are unique to the notebook experience. A notebook execution is a record of a particular piece of code, run at a particular point in time, in a particular environment. This combination of code, data and execution results into a single document makes notebooks powerful, but also difficult to reproduce. Indeed, the scientific computing community has documented some notebook reproducibility concerns as well as some best practices for reproducible notebooks.
Finally, another problem that might be unique to the ML space is the need for polyglot support. Machine learning researchers often work in multiple programming languages — for example, researchers might use Scala and Spark to generate training data (cleaning, subsampling, etc), while actual training might be done with popular Python ML libraries like tensorflow or scikit-learn.
Next, we’ll go through a deeper dive of Polynote’s features.
Reproducible by Design
Two of Polynote’s guiding principles are reproducibility and visibility. To further these goals, one of our earliest design decisions was to build Polynote’s code interpretation from scratch, rather than relying on a REPL like a traditional notebook.
We feel that while REPLs are great in general, they are fundamentally unfit for the notebook model. In order to understand the problems with REPLs and notebooks, let’s take a look at the design of a typical notebook environment.
A notebook is an ordered collection of cells, each of which can hold code or text. The contents of each cell can be modified and executed independently. Cells can be rearranged, inserted, and deleted. They can also depend on the output of other cells in the notebook.
Contrast this with a REPL environment. In a REPL session, a user inputs expressions into the prompt one at a time. Once evaluated, expressions and the results of their evaluation are immutable. Evaluation results are appended to the global state available to the next expression.
Unfortunately, the disconnect between these two models means that a typical notebook environment, which uses a REPL session to evaluate cell code, causes hidden state to accrue as users interact with the notebook. Cells can be executed in any order, mutating this global hidden state that in turn affects the execution of other cells. More often than not, notebooks are unable to be reliably rerun from the top, which makes them very difficult to reproduce and share with others. The hidden state also makes it difficult for users to reason about what’s going on in the notebook.
In other notebooks, hidden state means that a variable is still available after its cell is deleted.In a Polynote notebook, there is no hidden state. A deleted cell’s variables are no longer available.
Writing Polynote’s code interpretation from scratch allowed us to do away with this global, mutable state. By keeping track of the variables defined in each cell, Polynote constructs the input state for a given cell based on the cells that have run above it. Making the position of a cell important in its execution semantics enforces the principle of least surprise, allowing users to read the notebook from top to bottom. It ensures reproducibility by making it far more likely that running the notebook sequentially will work.
Better editing
Let’s face it — for someone used to IDEs, writing a nontrivial amount of code in a notebook can feel like going back in time a few decades. We’ve seen users who prefer to write code in an IDE instead, and paste it into the notebook to run. While it’s not our goal to provide all the features of a full-fledged modern IDE, there are a few quality-of-life code editing enhancements that go a long way toward improving usability.
Code editing in Polynote integrates with the Monaco editor for interactive auto-complete.Polynote highlights errors inside the code to help users quickly figure out what’s gone wrong.Polynote provides a rich text editor for text cells.The rich text editor allows users to easily insert LaTeX equations.
Visibility
As we mentioned earlier, visibility is one of Polynote’s guiding principles. We want it to be easy to see what the kernel is doing at any given time, without needing to dive into logs. To that end, Polynote provides a variety of UI treatments that let users know what’s going on.
Here’s a snapshot of Polynote in the midst of some code execution.
There’s quite a bit of information available to the user from a single glance at this UI. First, it is clear from both the notebook view and task list that Cell 1 is currently running. We can also see that Cells 2 through 4 are queued to be run, in that order.
We can also see the exact statement currently being run is highlighted in blue — the line defining the value `sumOfRandomNumbers`. Finally, since evaluating that statement launches a Spark job, we can also see job- and stage-level Spark progress information in the task list..
Here’s an animation of that execution so we can see how Polynote makes it easy to follow along with the state of the kernel.
Executing a Polynote notebook
The symbol table provides insight into the notebook internal state. When a cell is selected, the symbol table shows any values that resulted from the current cell’s execution above a black line, and any values available to the cell (from previous cells) below the line. At the end of the animation, we show the symbol table updating as we click on each cell in turn.
Finally, the kernel status area provides information about the execution status of the kernel. Below, we show a closeup view of how the kernel status changes from idle and connected, in green, to busy, in yellow. Other states include disconnected, in gray, and dead or not started, in red.
Kernel status changing from green (idle and connected) to yellow (busy)
Polyglot
You may have noticed in the screenshots shown earlier that each cell has a language dropdown in its toolbar. That’s because Polynote supports truly polyglot notebooks, where each cell can be written in a different language!
When a cell is run, the kernel provides the available typed input values to the cell’s language interpreter. In turn, the interpreter provides the resulting typed output values back to the kernel. This allows cells in Polynote notebooks to operate within the same context, and use the same shared state, regardless of which language they are defined in — so users can pick the best tool for the job at hand.
Here’s an example using scikit-learn, a Python library, to compute an isotonic regression of a dataset generated with Scala. This code is adapted from the Isotonic Regression example on the scikit-learn website.
A polyglot example showing data generation in Scala and data analysis in Python
As this example shows, Polynote enables users to fluently move from one language to another within the same notebook.
Dependency and Configuration Management
In order to better facilitate reproducibility, Polynote stores configuration and dependency information directly in the notebook itself, rather than relying on external files or a cluster/server level configuration. We found that managing dependencies directly in the notebookcode was clunky and could be confusing to users. Instead, Polynote provides a user-friendly Configuration section where users can set dependencies for each notebook.
Polynote’s Configuration UI, providing user-friendly, notebook-level configuration and dependency management
With this configuration, Polynote constructs an environment for the notebook. It fetches the dependencies locally (using Coursier or pip to fetch them from a repository) and loads the Scala dependencies into an isolated ClassLoader to reduce the chances of a class conflict with Spark libraries. Python dependencies are loaded into an isolated virtualenv. When Polynote is used in Spark mode, it creates a Spark Session for the notebook which uses the provided configuration. The Python and Scala dependencies are automatically added to the Spark Session.
Data Visualization
One of the most important use cases of notebooks is the ability to explore and visualize data. Polynote integrates with two of the most popular open source visualization libraries, Vega and Matplotlib.
While matplotlib integration is quite standard among notebooks, Polynote also has native support for data exploration — including a data schema view, table inspector, plot constructor and Vega support.
We’ll walk through a quick example of some data analysis and exploration using the tools mentioned above, using the Wine Reviews dataset from Kaggle. First, here’s a quick example of just loading the data in Spark, seeing the Schema, plotting it and saving that plot in the notebook.
Example of data exploration using the plot constructor
Let’s focus on some of what we’re seeing here.
View of the quick inspector, showing the DataFrame’s schema. The blue arrow points to the quick access buttons to the table view (left) and plot view (right)
If the last statement of a cell is an expression, it gets assigned to the cell’s Out variable. Polynote will display a representation of the result in a fashion determined by its data type. If it’s a table-like data type, such as a DataFrame or collection of case classes, Polynote shows the quick inspector, allowing users to see schema and type information at a glance.
The quick inspector also provides two buttons that bring up the full data inspector — the button on the left brings up the table view, while the button on the right brings up the plot constructor. The animation also shows the plot constructor and how users can drag and drop measures and dimensions to create different plots.
We also show how to save a plot to the notebook as its own cell. Because Polynote natively supports Vega specs, saving the plot simply inserts a new Vega cell with a generated spec. As with any other language, Vega specs can leverage polyglot support to refer to values from previous cells. In this case, we’re using the Out value (a DataFrame) and performing additional aggregations on it. This enables efficient plotting without having to bring millions of data points to the client. Polynote’s Vega spec language provides an API for aggregating and otherwise modifying table-like data streams.
A Vega cell generated by the plot constructor, showing its spec
Vega cells don’t need to be authored using the plot constructor — any Vega spec can be put into a Vega cell and plotted directly, as seen below.
In addition to the cell result value, any variable in the symbol table can be inspected with a click.
Inspecting a variable in the symbol table
The road ahead
We have described some of the key features of Polynote here. We’re proud to share Polynote widely by open sourcing it, and we’d love to hear your feedback. Take it for a spin today by heading over to our website or directly to the code and let us know what you think! Take a look at our currently open issues and to see what we’re planning, and, of course, PRs are always welcome! Polynote is still very much in its infancy, so you may encounter some rough edges. It is also a powerful tool that enables arbitrary code execution (“with great power, comes great responsibility”), so please be cognizant of this when you use it in your environment.
Plenty of exciting work lies ahead. We are very optimistic about the potential of Polynote and we hope to learn from the community just as much as we hope they will find value from Polynote. If you are interested in working on Polynote or other Machine Learning research, engineering and infrastructure problems, check out the Netflix Research site as well as some of the current openings.
Acknowledgements
Many colleagues at Netflix helped us in the early stages of Polynote’s development. We would like to express our tremendous gratitude to Aish Fenton, Hua Jiang, Kedar Sadekar, Devesh Parekh, Christopher Alvino, and many others who provided thoughtful feedback along their journey as early adopters of Polynote.
Almost a year ago we described our learnings from adopting GraphQL on the Netflix Marketing Tech team. We have a lot more to share since then! There are plenty of existing resources describing how to express a search query in GraphQL and paginate the results. This post looks at the other side of search: how to index data and make it searchable. Specifically, how our team uses the relationships and schemas defined within GraphQL to automatically build and maintain a search database.
Marketing Tech at Netflix
Our goal is to promote Netflix’s content across the globe. Netflix has thousands of shows on the service, operates in over 190 countries, and supports around 30 languages. For each of these shows, countries, and languages we need to find the right creative that resonates with each potential viewer. Our team builds the tools to produce and distribute these marketing creatives at a global scale, powering 10s of billions of impressions every month!
Various creatives Marketing Tech supports
To enable our marketing stakeholders to manage these creatives, we need to pull together data that is spread across many services — GraphQL makes this aggregation easy.
As an example, our data is centered around a creative service to keep track of the creatives we build. Each creative is enhanced with more information on the show it promotes, and the show is further enhanced with its ranking across the world. Also, our marketing team can comment on the creative when adjustments are needed. There are many more relationships that we maintain, but we will focus on these few for the post.
GraphQL query before indexing
Challenges of Searching Decentralized Data
Displaying the data for one creative is helpful, but we have a lot of creatives to search across. If we produced only a few variations for each of the shows, languages, and countries Netflix supports, that would result in over50 million total creatives. We needed a proper search solution.
The problem stems from the fact that we are trying to search data across multiple independent services that are loosely coupled. No single service has complete context into how the system works. Each service could potentially implement its own search database, but then we would still need an aggregator. This aggregator would need to perform more complex operations, such as searching for creatives by ranking even though the ranking data is stored two hops away in another service.
If we had a single database with all of the information in it, the search would be easy. We can write a couple join statements and where clauses: problem solved. Nevertheless, a single database has its own drawbacks, mainly, around limited flexibility in allowing teams to work independently and performance limitations at scale.
Another option would be to use a custom aggregation service that builds its own index of the data. This service would understand where each piece of data comes from, know how all of the data is connected, and be able to combine the data in a variety of ways. Apart from the indexing part, these characteristics perfectly describe the entity relationships in GraphQL.
Indexing the Data
Since we already use GraphQL, how can we leverage it to index our data? We can update our GraphQL query slightly to retrieve a single creative and all of its related data, then call that query once for each of the creatives in our database, indexing the results into Elasticsearch. By batching and parallelizing the requests to retrieve many creatives via a single query to the GraphQL server, we can optimize the index building process.
GraphQL query for indexing
Elasticsearch has a lot of customization options when indexing data, but in many cases the default settings give pretty good results. At a minimum, we extract all of the type definitions from the GraphQL query and map them to a schema for Elasticsearch to use.
The nice part about using a GraphQL query to generate the schema is that any existing clients relying on this data will get the same shape of data regardless of whether it comes from the GraphQL server or the search index directly.
Once our data is indexed, we can sort, group, and filter on arbitrary fields; provide typeahead suggestions to our users; display facets for quick filtering; and progressively load data to provide an infinite scroll experience. Best of all, our page can load much faster since everything is cached in Elasticsearch.
Keeping Everything Up To Date
Indexing the data once isn’t enough. We need to make sure that the index is always up to date. Our data changes constantly — marketing users make edits to creatives, our recommendation algorithm refreshes to give the latest title popularity rankings and so on. Luckily, we have Kafka events that are emitted each time a piece of data changes. The first step is to listen to those events and act accordingly.
When our indexer hears a change event it needs to find all the creatives that are affected and reindex them. For example, if a title ranking changes, we need to find the related show, then its corresponding creative, and reindex it. We could hardcode all of these rules, but we would need to keep these rules up to date as our data evolves and for each new index we build.
Fortunately, we can rely on GraphQL’s entity relationships to find exactly what needs to be reindexed. Our search indexer understands these relationships by accessing a shared GraphQL schema or using an introspection query to retrieve the schema.
Our GraphQL query represented as a tree
In our earlier example, the indexer can fan out one level from title ranking to show by automatically generating a query to GraphQL to find shows that are related to the changed title ranking. After that, it queries Elasticsearch using the show and title ranking data to find creatives that reference these values. It can reindex those creatives using the same pipeline used to index them in the first place. What makes this method so great is that after defining GraphQL schemas and resolvers once, there is no additional work to do. The graph has enough data to keep the search index up to date.
Inverted Graph Index
Let’s look a bit deeper into the three steps the search indexer conducts: fan out, search, and index. As an example, if the algorithm starts recommending show 80186799 in Finland, the indexer would generate a GraphQL query to find the immediate parent: the show that the algorithm data is referring to. Once it finds that this recommendation is for Stranger Things, it would use Elasticsearch’s inverted index to find all creatives with show Stranger Things or with the algorithm recommendation data. The creatives are updated via another call to GraphQL and reindexed back to Elasticsearch.
The fan out step is needed in cases where the vertex update causes new edges to be created. If our algorithm previously didn’t have enough data to rank Stranger Things in Finland, the search step alone would never find this data in our index. Also, the fan out step does not need to perform a full graph search. Since GraphQL resolvers are written to only rely on data from the immediate parent, any vertex change can only impact its own edges. The combination of the single graph traversal and searching via an inverted index allows us to greatly increase performance for more complex graphs.
The fanout + search pattern works with more complex graphs
The indexer currently reruns the same GraphQL query that we used to first build our index, but we can optimize this step by only retrieving changes from the parent of the changed vertex and below. We can also optimize by putting a queue in front of both the change listener and the reindexing step. These queues debounce, dedupe, and throttle tasks to better handle spikes in workload.
The overall performance of the search indexer is fairly good as well. Listening to Kafka events adds little latency, our fan out operations are really quick since we store foreign keys to identify the edges, and looking up data in an inverted index is fast as well. Even with minimal performance optimizations, we have seen median delays under 500ms. The great thing is that the search indexer runs in close to constant time after a change, and won’t slow down as the amount of data grows.
Periodic Indexing
We run a full indexing job when we define a new index or make breaking schema changes to an existing index.
In the latter case, we don’t want to entirely wipe out the old index until after verifying that the newly indexed data is correct. For this reason, we use aliases. Whenever we start an indexing job, the indexer always writes the data to a new index that is properly versioned. Additionally, the change events need to be dual written to the new index as it is being built, otherwise, some data will be lost. Once all documents have been indexed with no errors, we swap the alias from the currently active index to the newly built index.
In cases where we can’t fully rely on the change events or some of our data does not have a change event associated with it, we run a periodic job to fully reindex the data. As part of this regular reindexing job, we compare the new data being indexed with the data currently in our index. Keeping track of which fields changed can help alert us of bugs such as a change events not being emitted or hidden edges not modeled within GraphQL.
Initial Setup
We built all of this logic for indexing, communicating with GraphQL, and handling changes into a search indexer service. In order to set up the search indexer there are a few requirements:
Kafka. The indexer needs to know when changes happen. We use Kafka to handle change events, but any system that can notify the indexer of a change in the data would be sufficient.
GraphQL. To act on the change, we need a GraphQL server that supports introspection. The graph has two requirements. First, each vertex must have a unique ID to make it easily identifiable by the search step. Second, for fan out to work, edges in the graph must be bidirectional.
Elasticsearch. The data needs to be stored in a search database for quick retrieval. We use Elasticsearch, but there are many other options as well.
Search Indexer. Our indexer combines the three items above. It is configured with an endpoint to our GraphQL server, a connection to our search database, and mappings from our Kafka events to the vertices in the graph.
How our search indexer is wired up
Building a New Index
After the initial setup, defining a new index and keeping it up to date is easy:
GraphQL Query. We need to define the GraphQL query that retrieves the data we want to index.
That’s it.
Once the initial setup is complete, defining a GraphQL query is the only requirement for building a new index. We can define as many indices as needed, each having its own query. Optionally, since we want to reindex from scratch, we need to give the indexer a way to paginate through all of the data, or tell it to rely on the existing index to bootstrap itself. Also, if we need custom mappings for Elasticsearch, we would need to define the mappings to mirror the GraphQL query.
The GraphQL query defines the fields we want to index and allows the indexer to retrieve data for those fields. The relationships in GraphQL allow keeping the index up to date automatically.
Where the Index Fits
The output of the search indexer feeds into an Elasticsearch database, so we needed a way to utilize it. Before we indexed our data, our browser application would call our GraphQL server, asking it to aggregate all of the data, then we filtered it down on the client side.
Data flow before indexing
After indexing, the browser can now call Elasticsearch directly (or via a thin wrapper to add security and abstract away database complexities). This setup allows the browser to fully utilize the search functionality of Elasticsearch instead of performing searches on the client. Since the data is the same shape as the original GraphQL query, we can rely on the same auto-generated Typescript types and don’t need major code changes.
Data flow after indexing
One additional layer of abstraction we are considering, but haven’t implemented yet, is accessing Elasticsearch via GraphQL. The browser would continue to call the GraphQL server in the same way as before. The resolvers in GraphQL would call Elasticsearch directly if any search criteria are passed in. We can even implement the search indexer as middleware within our GraphQL server. It would enhance the schema for data that is indexed and intercept calls when searches need to be performed. This approach would turn search into a plugin that can be enable on any GraphQL server with minimal configuration.
Using GraphQL to abstract away Elasticsearch
Caveats
Automatically indexing key queries on our graph has yielded tremendously positive results, but there are a few caveats to consider.
Just like with any graph, supernodes may cause problems. A supernode is a vertex in the graph that has a disproportionately large number of edges. Any changes that affect a supernode will force the indexer to reindex many documents, blocking other changes from being reindexed. The indexer needs to throttle any changes that affect too many documents to keep the queue open for smaller changes that only affect a single document.
The relationships defined in GraphQL are key to determining what to reindex if a change occurred. A hidden edge, an edge not defined fully by one of the two vertices it connects, can prevent some changes from being detected. For example, if we model the relationship between creatives and shows via a third table containing tuples of creative IDs and show IDs, that table would either need to be represented in the graph or its changes attributed to one of the vertices it connects.
By indexing data into a single store, we lose the ability to differentiate user specific aspects of the data. For example, Elasticsearch cannot store unread comment count per user for each of the creatives. As a workaround, we store the total comment count per creative in Elasticsearch, then on page load make an additional call to retrieve the unread counts for the creatives with comments.
Many UI applications practice a pattern of read after write, asking the server to provide the latest version of a document after changes are made. Since the indexing process is asynchronous to avoid bottlenecks, clients would no longer be able to retrieve the latest data from the index immediately after making a modification. On the other hand, since our indexer is constantly aware of all changes, we can expose a websocket connection to the client that notifies it when certain documents change.
The performance savings from indexing come primarily from the fact that this approach shifts the workload of aggregating and searching data from read time to write time. If the application exhibits substantially more writes than reads, indexing the data might create more of a performance hit.
The underlying assumption of indexing data is that you need robust search functionality, such as sorting, grouping, and filtering. If your application doesn’t need to search across data, but merely wants the performance benefits of caching, there are many other options available that can effectively cache GraphQL queries.
Finally, if you don’t already use GraphQL or your data is not distributed across multiple databases, there are plenty of ways to quickly perform searches. A few table joins in a relational database provide pretty good results. For larger scale, we’re building a similar graph-based solution that multiple teams across Netflix can leverage which also keeps the search index up to date in real time.
There are many other ways to search across data, each with its own pros and cons. The best thing about using GraphQL to build and maintain our search index is its flexibility, ease of implementation, and low maintenance. The graphical representation of data in GraphQL makes it extremely powerful, even for use cases we hadn’t originally imagined.
If you’ve made it this far and you’re also interested in joining the Netflix Marketing Technology team to help conquer our unique challenges, check out the open positions listed on our page. We’re hiring!
GraphQL Search Indexing was originally published in Netflix TechBlog on Medium, where people are continuing the conversation by highlighting and responding to this story.
At Netflix, we spend a lot of effort to make it easy for our members to find content they will love. To make this happen, we personalize many aspects of our service, including which movies and TV shows we present on each member’s homepage. Over the years, we have built a recommendation system that uses many different machine learning algorithms to create these personalized recommendations. We also apply additional business logic to handle constraints like maturity filtering and deduplication of videos. All of these algorithms and logic come together in our page generation system to produce a personalized homepage for each of our members, which we have outlined in a previous post. While a diverse set of algorithms working together can produce a great outcome, innovating on such a complex system can be difficult. For instance, adding a single feature to one of the recommendation algorithms can change how the whole page is put together. Conversely, a big change to such a ranking system may only have a small incremental impact (for instance because it makes the ranking of a row similar to that of another existing row).
Every aspect is personalized
With systems driven by machine learning, it is important to measure the overall system-level impact of changes to a model, not just the local impact on the model performance itself. One way to do this is by running A/B tests. Netflix typically A/B tests all changes before rolling them out to all members. A drawback to this approach is that tests take time to run and require experimental models be ready to run in production. In Machine Learning, offline metrics are often used to measure the performance of model changes on historical data. With a good offline metric, we can gain a reasonable understanding of how a particular model change would perform online. We would like to extend this approach, which is typically applied to a single machine-learned model, and apply it to the entire homepage generation system. This would allow us to measure the potential impact of offline changes in any of the models or logic involved in creating the homepage before running an A/B test.
To achieve this goal, we have built a system that simulates what a member’s homepage would have been given an experimental change and compares it against the page the member actually saw in the service. This provides an indication of the overall quality of the change. While we primarily use this for evaluating modifications to our machine learning algorithms, such as what happens when we have a new row selection or ranking algorithm, we can also use it to evaluate any changes in the code used to construct the page, from filtering rules to new row types. A key feature of this system is the ability to reconstruct a view of the systemic and user-level data state at a certain point in the past. As such, the system uses time-travel mechanisms for more precise reconstruction of an experience and coordinates time-travel across multiple systems. Thus, the simulator allows us to rapidly evaluate new ideas without needing to expose members to the changes.
In this blog post, we will go into more detail about this page simulation system and discuss some of the lessons we learned along the way.
Why Is This Hard?
A simulation system needs to run on many samples to generate reliable results. In our case, this requirement translates to generating millions of personalized homepages. Naturally, some problems of scale come into the picture, including:
How to ensure that the executions run within a reasonable time frame
How to coordinate work despite the distributed nature of the system
How to ensure that the system is easy to use and extend for future types of experiments
Stages Involved
At a high level, the Page Simulation system consists of the following stages:
We’ll go through each of these stages in more detail below.
Experiment Scope
The experiment scope determines the set of experimental pages that will be simulated and which data sources will be used to generate those pages. Thus, the experimenter needs to tailor the scope to the metrics the experiment aims to measure. This involves defining three aspects:
A data source
Stratification rules for profile selection
Number of profiles for the experiment
Data Sources
We provide two different mechanisms for data retrieval: via time travel and via live service calls.
In the first approach, we use data from time-travel infrastructure built at Netflix to compute pages as they would have been at some point in the past. In the experimentation landscape, this gives us the ability to backtest the performance of experimental page generation model accurately. In particular, it lets us compare a new page against a page that a member has seen and interacted with in the past, including what actions they took in the session.
The second approach retrieves data in the exact same way as the live production system. To simulate production systems closely, in this mode, we randomly select profiles that have recently logged into Netflix. The primary drawback of using live data is that we can only compute a limited set of metrics compared to the time-travel approach. However, this type of experiment is still valuable in the following scenarios:
Doing final sanity checks before allocating a new A/B test or rolling out a new feature
Analyzing changes in page composition, which are measures of the rows and videos on the page. These measures are needed to validate that the changes we seek to test are having the intended effect without unexpected side-effects
Determining if two approaches are producing sufficiently similar pages that we may not need to test both
Early detection of negative interactions between two features that will be rolled out simultaneously
Stratification
Once the data source is specified, a combination of different stratification types can be applied to refine user selection. Some examples of stratification types are:
Country — select profiles based on their country
Tenure — select profiles based on their membership tenure; long-term members vs members in trial period
Login device — select users based on their active device type; e.g. Smart TV, Android, or devices supporting certain feature sets
Number of Profiles
We typically start with a small number to perform a dry run of the experiment configuration and then extend it to millions of users to ensure reliable and statistically significant results.
Simulating Modified Behavior
Once the experiment scope is determined, experimenters specify the modifications they would like to test within the page generation framework. Generally, these changes can be made by either modifying the configuration of the existing system or by implementing new code and deploying it to the simulation system.
There are several ways to control what changes are run in the simulator, including but not limited to:
A/B test allocations
Collect metrics of the behavior of an A/B test that is not yet allocated
Analyze the behavior across cells using custom metrics
Inspect the effect of cross-allocating members to multiple A/B tests
2. Page generation models
Compare performance of different page generation models
Evaluate interactions between different models (when page is constructed using multiple models)
3. Device capabilities and page geometry
Evaluate page composition for different geometries. Page geometry is the number of rows and columns, which differs between device types
Multiple modifications can be grouped together to define different experimental variants. During metrics computation we collect each metric at the level of variant and stratum. This detailed breakdown of metrics allows for a fine-grained attribution of any shifts in page characteristics.
Experiment Workflow
Architecture diagram of the Page Simulation System
The lifecycle of an experiment starts when a user (Engineer, Researcher, Data Scientist or Product Manager) configures an experiment and submits it for execution (detailed below). Once the execution is complete, they get detailed Tableau reports. Those reports contain page composition and other important metrics regarding their experiment, which can be split by the different variants under test.
The execution workflow for the experiment proceeds through the following stages:
Partition the experiment into smaller chunks
Compute pages asynchronously for each partition
Compute experiment metrics
Experiment Partition
In the Page Simulation system an experiment is configured as a single entity, however when executing the experiment, the system splits it into multiple partitions. This is needed to isolate different parts of the experiment for the following reasons:
Some modifications to the page algorithm might impact the latency of page generation significantly
When time traveling to different times, different clusters of the page generation system are needed for each time (more on this later)
Asynchronous Page Computation
We embrace asynchronous computation as much as possible, especially in the page computation stage, which can be very compute-intensive and time consuming due to the heavy machine-learned models we often test. Each experiment partition is sent out as an event to a Request Poster. The Request Poster is responsible for reading data and applying stratification to select profiles for each partition. For each selected profile, page computation requests are generated and sent to a dedicated queue per partition. Each queue is then processed by a separate Page Generation cluster that is launched to serve a particular partition. Once the generator is running, it processes the requests in the queue to compute the simulated pages. Generated pages are then persisted to an S3-backed Hive table for metrics processing.
We chose to use queue-based communication between the systems instead of RESTFul calls to decouple the systems and allow for easy retries of each request, as well as individual experiment partitions. Writing the generated pages to Hive and running the Metrics Computation stage out-of-band allows us to modify or add new metrics on previously generated pages, thus avoiding needing to regenerate them.
Creating Mini Netflix Ecosystem on the Fly
The page generation system at Netflix consists of many interdependent services. Experiments can simulate new behaviors in any number of these microservices. Thus, for each experiment, we need to create an isolated mini Netflix ecosystem where each service exhibits their respective new behaviors. Because of this isolation requirement, we architected a system that can create a mini Netflix ecosystem on the fly.
Our approach is to create Docker container stacks to define a mini Netflix ecosystem for each simulation. We use Titus as a container management platform, which was built internally at Netflix. We configure each cluster using custom bootstrapping code in order to create different server environments, for example to initialize the containers with different machine-learned model versions and other data to precisely replicate time-traveled state in the past. Because we would like to time-travel all the services together to replicate a specific point in time in the past, we created a new capability to start stacks of multiple services with a common time configuration and route traffic between them on-the-fly per experiment to maintain temporal accuracy of the data. This capability provides the precision we need to simulate and correlate metrics correctly with actions of our members that happened in the past.
Achieving high temporal accuracy across multiple systems and data sources is challenging. It took us several iterations to determine the correct set of data and services to include in this time-travel scheme for accurate simulation of pages in time-travel mode. To this end, we developed tools that compared real pages computed by our live production system with that of our simulators, both in terms of the final output and the features involved in our models. To ensure that we maintain temporal accuracy going forward, we also automated these checks to avoid future regressions and identify new data sources that we need to handle. As such, the system is architected in a flexible way so we can easily incorporate more downstream systems into the time-travel experiment workflow.
Metrics Computation
Once the generated pages are saved to a Hive table, the system sends a signal to the workflow manager (Controller) for the completion of the page generation experiment. This signal triggers a Spark job to calculate the metrics, normalize the results and save both the raw and normalized data to Hive. Experimenters can then access the results of their experiment either using pre-configured Tableau reports or from notebooks that pull the raw data from Hive. If necessary, they can also access the simulated pages to compute new experiment-specific metrics.
Experiment Workflow Management
Given the asynchronous nature of the experiment workflow and the need to govern the lifecycle of multiple clusters dedicated to each partition, we needed a solution to manage the experiment workflow. Thus, we built a simple and lightweight workflow management system with the following capabilities:
Automatic retry of workflow steps in case of a transient failure
Conditional execution of workflow steps
Recording execution history
We use this simple workflow engine for the execution of the following tasks:
Govern the lifecycle of page generation services dedicated to each partition (external startup, shutdown tasks)
Initialize metrics computation when page generation for all partitions is complete
Terminate the experiment when the experiment does not have a sufficient page yield (i.e. there is a high error rate)
Send out notifications to experiment owners on the status of the experiment
Listen to the heartbeat of all components in the experimentation system and terminate the experiment when an issue is detected
Status Keeper
To facilitate lifecycle management and to monitor the overall health of an experiment, we built a separate micro-service called Status Keeper. This service provides the following capabilities:
Expose a detailed report with granular metrics about different steps (Controller / Request Poster / Page Generator and Metrics Processor) in the system
Aid in lifecycle decisions to fast fail the experiment if failure threshold has reached
Store and retrieve status and aggregate metrics
Throughout the experiment workflow, each application in the Page Simulation system reports its status to the Status Keeper. We combine all the status and metrics recorded by each application in the system to create a view of the overall health of the system.
Metrics
Need for Offline Metrics
An important part of improving our page generation approach is having good offline metrics to track model performance and to compare different model variants. Usually, there is not a perfect correspondence between offline results and results from A/B testing (if there was, it would do away with the need for online testing). For example, suppose we build two model variants and we find that one is better than the other according to our offline metric. The online A/B test performance will usually be measured by a different metric, and it may turn out that the model that’s worse on the offline metric is actually the better model online or even that there is no statistically significant difference between the two models online. Given that A/B tests need to run for a while to measure long-term metrics, finding an offline metric that provides an accurate pulse of how the testing might pan out is critical. So one of the main objectives in building our page simulation system was to come up with offline metrics that correspond better with online A/B metrics.
Presentation Bias
One major source of discrepancy between online and offline results is presentation bias. The real pages we presented to our members are the result of ranking videos and rows from our current production page generation models. Thus, the engagement data (what members click, play or thumb) we get as a result can be strongly influenced by those models. Members can only see and play from rows that the production system served to them. Thus, it is important that our offline metrics mitigate this bias (i.e. it should not unduly favor or disfavor the production model).
Validation
In the absence of A/B testing results on new candidate models, there is no ground truth to compare offline metrics against. However, because of the system described above, we can simulate how a member’s page might have looked at a past point-in-time if it had been generated by our new model instead of the production model. Because of time travel, we could also build the new model based on the data available at that time so as to get us as close as possible to the unobserved counterfactual page that the new model would have shown.
Given these pages, the next question to answer was exactly what numerical metrics we can use for validating the effectiveness of our offline metrics. This turned out to be easy with the new system because we could use models from past A/B tests to ascertain how well the offline metrics computed on the simulated pages correlated with the actual online metrics for those A/B tests. That is, we could take the hypothetical pages generated by certain models, evaluate them according to an offline metric, and then see how well those offline metrics correspond to online ones. After trying out a few variations, we were able to settle on a suite of metrics that had a much stronger correlation with corresponding online metrics across many A/B tests as compared to our previous offline metric, as shown below.
Benefits
Having such offline metrics that strongly correlate with online metrics allows us to experiment more rapidly and reject model variants which may not be significantly better than the current production model, thus saving valuable A/B testing bandwidth and time. It has also helped us detect bugs early in the model development process when the offline metrics go vigorously against our hypothesis. This has saved many development cycles, experimentation cycles, and has enabled us to try out more ideas.
In addition, these offline metrics enable us to:
Compare models trained with different objective functions
Compare models trained on different datasets
Compare page construction related changes outside of our machine learning models
Reconcile effects due to changes arising out of many A/B tests running simultaneously
Conclusion
Personalizing home pages for users is a hard problem and one that traditionally required us to run A/B tests to find out whether a new approach works. However, our Page Simulation system allows us to rapidly try out new ideas and obtain results without needing to expose our members to all these experiences. Being able to create a mini Netflix ecosystem on the fly helps us iterate fast and allows us to try out more far-fetched ideas. Building this system was a big collaboration between our engineering and research teams that allows our researchers to run page simulations and our engineers to quickly extend the system to accommodate new types of simulations. This, in turn, has resulted in improvements of the personalized homepages for our members. If you are interested in helping us solve these types of problems and helping entertain the world, please take a look at some of our open positions on the Netflix jobs page.
Page Simulator was originally published in Netflix TechBlog on Medium, where people are continuing the conversation by highlighting and responding to this story.
AWS re:Invent is a couple weeks away and our engineers & leaders are thrilled to be in attendance yet again this year! Please stop by our “Living Room” for an opportunity to connect or reconnect with Netflixers. We’ve compiled our speaking events below so you know what we’ve been working on. We look forward to seeing you there!
Monday — December 2
1pm-2pm CMP 326-R Capacity Management Made Easy with Amazon EC2 Auto Scaling
Abstract:Amazon EC2 Auto Scaling offers a hands-free capacity management experience to help customers maintain a healthy fleet, improve application availability, and reduce costs. In this session, we deep-dive into how Amazon EC2 Auto Scaling works to simplify continuous fleet management and automatic scaling with changing load. Netflix delivers shows like Sacred Games, Stranger Things, Money Heist, and many more to more than 150 million subscribers across 190+ countries around the world. Netflix shares how Amazon EC2 Auto Scaling allows its infrastructure to automatically adapt to changing traffic patterns in order to keep its audience entertained and its costs on target.
4:45pm-5:45pm NFX 202 A day in the life of a Netflix Engineer
Abstract: Netflix is a large, ever-changing ecosystem serving millions of customers across the globe through cloud-based systems and a globally distributed CDN. This entertaining romp through the tech stack serves as an introduction to how we think about and design systems, the Netflix approach to operational challenges, and how other organizations can apply our thought processes and technologies. In this session, we discuss the technologies used to run a global streaming company, growing at scale, billions of metrics, benefits of chaos in production, and how culture affects your velocity and uptime.
4:45pm-5:45pm NFX 209 File system as a service at Netflix
Abstract: As Netflix grows in original content creation, its need for storage is also increasing at a rapid pace. Technology advancements in content creation and consumption have also increased its data footprint. To sustain this data growth at Netflix, it has deployed open-source software Ceph using AWS services to achieve the required SLOs of some of the post-production workflows. In this talk, we share how Netflix deploys systems to meet its demands, Ceph’s design for high availability, and results from our benchmarking.
Tuesday — December 3
11:30am-12:30pm NFX 208 Netflix’s container journey to bare metal Amazon EC2
Abstract: In 2015, Netflix started supporting containers as part of their compute platform. Over the years, this platform took on support for both elastic online services and fully featured batch workloads supporting use cases across Netflix engineering. It launches more than four million containers per week across thousands of underlying hosts. The release of Amazon EC2 bare metal instances gave direct access to host processors and memory while providing a control plane for these container hosts. In 2019, Netflix moved thousands of container hosts to bare metal. This talk explores the journey, learnings, and improvements to performance analysis, efficiency, reliability, and security.
5:30pm-6:30pm CMP 326-R Capacity Management Made Easy
Abstract: Amazon EC2 Auto Scaling offers a hands-free capacity management experience to help customers maintain a healthy fleet, improve application availability, and reduce costs. In this session, we deep-dive into how Amazon EC2 Auto Scaling works to simplify continuous fleet management and automatic scaling with changing load. Netflix delivers shows like Sacred Games, Stranger Things, Money Heist, and many more to more than 150 million subscribers across 190+ countries around the world. Netflix shares how Amazon EC2 Auto Scaling allows its infrastructure to automatically adapt to changing traffic patterns in order to keep its audience entertained and its costs on target.
Wednesday — December 4
10am-11am NFX 203 From Pitch to Play: The technology behind going from ideas to streaming
Abstract: It takes a lot of different technologies and teams to get entertainment from the idea stage through being available for streaming on the service. This session looks at what it takes to accept, produce, encode, and stream your favorite content. We explore all the systems necessary to make and stream content from Netflix.
1pm-2pm NFX 207 Benchmarking stateful services in the cloud
Abstract: AWS cloud services make it possible to achieve millions of operations per second in a scalable fashion across multiple regions. Netflix runs dozens of stateful services on AWS under strict sub-millisecond tail-latency requirements, which brings unique challenges. In order to maintain performance, benchmarking is a vital part of our system’s lifecycle. In this session, we share our philosophy and lessons learned over the years of operating stateful services in AWS. We showcase our case studies, open-source tools in benchmarking, and how we ensure that AWS cloud services are serving our needs without compromising on tail latencies.
3:15pm-4:15pm OPN 209 Netflix’s application deployment at scale
Andy Glover, Director Delivery Engineering & Paul Roberts, AWS
Abstract: Spinnaker is an open-source continuous-delivery platform created by Netflix to improve its developers’ efficiency and reduce the time it takes to get an application into production. Netflix has over 140 million members, and in this session, Netflix shares the tooling it uses to deploy applications to meet its customers’ needs. Join us to learn why Netflix created Spinnaker, how the platform is being used at scale, how the company works with the broader open-source community, and the work it’s doing with AWS to build out a new functions compute primitive.
Abstract: Extended BPF (eBPF) is an open-source Linux technology that powers a whole new class of software: mini programs that run on events. Among its many uses, BPF can be used to create powerful performance-analysis tools capable of analyzing everything: CPUs, memory, disks, file systems, networking, languages, applications, and more. In this session, Netflix’s Brendan Gregg tours BPF tracing capabilities, including many new open-source performance analysis tools he developed for his new book “BPF Performance Tools: Linux System and Application Observability.” The talk also includes examples of using these tools in the Amazon Elastic Compute Cloud (Amazon EC2) cloud.
Travis McPeak, Application Security Engineering Manager & William Bengston, Director HashiCorp
Abstract: AWS CloudTrail provides a wealth of information on your AWS environment. In addition, teams can use it to perform basic anomaly detection by adding state. In this talk, Travis McPeak of Netflix and Will Bengtson introduce a system built strictly with off-the-shelf AWS components that tracks CloudTrail activity across multi-account environments and sends alerts when applications perform anomalous actions. By watching applications for anomalous actions, security and operations teams can monitor unusual and erroneous behavior. We share everything attendees need to implement CloudTrail in their own organizations.
Abstract: Extended BPF (eBPF) is an open-source Linux technology that powers a whole new class of software: mini programs that run on events. Among its many uses, BPF can be used to create powerful performance-analysis tools capable of analyzing everything: CPUs, memory, disks, file systems, networking, languages, applications, and more. In this session, Netflix’s Brendan Gregg tours BPF tracing capabilities, including many new open-source performance analysis tools he developed for his new book “BPF Performance Tools: Linux System and Application Observability.” The talk also includes examples of using these tools in the Amazon Elastic Compute Cloud (Amazon EC2) cloud.
1:45pm-2:45pm NFX 201 More Data Science with less engineering: ML Infrastructure
Ville Tuulos, Machine Learning Infrastructure Engineering Manager
Abstract: Netflix is known for its unique culture that gives an extraordinary amount of freedom to individual engineers and data scientists. Our data scientists are expected to develop and operate large machine learning workflows autonomously without the need to be deeply experienced with systems or data engineering. Instead, we provide them with delightfully usable ML infrastructure that they can use to manage a project’s lifecycle. Our end-to-end ML infrastructure, Metaflow, was designed to leverage the strengths of AWS: elastic compute; high-throughput storage; and dynamic, scalable notebooks. In this session, we present our human-centric design principles that enable the autonomy our engineers enjoy.
Julie (Novak) Beckley, Andy Rhines, Jeffrey Wong, Matthew Wardrop, Toby Mao, Martin Tingley
Ever wonder why Netflix works so well when you’re streaming at home, on the train, or in a foreign hotel? Behind the scenes, Netflix engineers are constantly striving to improve the quality of your streaming service. The goal is to bring you joy by delivering the content you love quickly and reliably every time you watch. To do this, we have teams of experts that develop more efficient video and audio encodes, refine the adaptive streaming algorithm, and optimize content placement on the distributed servers that host the shows and movies that you watch. Within each of these areas, teams continuously run large-scale A/B experiments to test whether their ideas result in a more seamless experience for members.
With all these experiments, we aim to improve the Quality of Experience (QoE) for Netflix members. QoE is measured with a compilation of metrics that describe everything about the user’s experience from the time they press play until the time they finish watching. Examples of such metrics include how quickly the content starts playing and the number of times the video froze during playback (number of rebuffers).
Suppose the encoding team develops more efficient encodes that improve video quality for members with the lowest quality (those streaming on low bandwidth networks). They need to understand whether there was a meaningful improvement or if their A/B test results were due to noise. This is a hard problem because we must determine if and how the QoE metric distributions differ between experiences. At Netflix, we addressed these challenges by developing custom tools that use the bootstrap, a resampling technique for quantifying statistical significance. This helps the encoding team move past means and medians to evaluate how well the new encodes are working for all members, by enabling them to easily understand movements in different parts of a metric’s distribution. They can now answer questions such as: “Has the intervention improved the experience for the 5th percentile (corresponding to members with generally low video quality) while deteriorating the experience for the 95th (corresponding to those with generally high video quality), or has the intervention had a positive impact on all members?”
Although our engineering stakeholders loved the statistical insights, obtaining them was time consuming and inconvenient. When moving from an ad-hoc solution to integration into our internal platform, ABlaze, we encountered scaling challenges. For our methods to power all streaming experimentation reports, we needed to precompute the results for hundreds of streaming experiments, all segments of the population (e.g. device types), and all metrics. To make this happen, we developed an effective data compression technique by cleverly bucketing our data. This reduced the volume of our data by up to 1,000 times, allowing us to compute statistics in just a few seconds while maintaining precise results. The development of an effective data compression strategy enabled us to deploy bootstrapping methods at dramatically greater scale, allowing experimenters to analyze their A/B test results faster and with clearer insights.
Compression is used in many statistical applications, but why is it so valuable for Quality of Experience metrics? In short: we are interested in detecting arbitrary changes in various distributions while not making parametric assumptions, and simple statistical summarization methods are insufficient.
The Bootstrapping Methods
Suppose you are watching The Crown on a train and Claire Foy’s face appears pixelated. Your instinct might tell you this is caused by an unusually slow network, but you still become frustrated that the video quality is not perfect. The encoding team can develop a solution for this scenario, but they need a way to test how well it actually worked.
In this section we briefly go over two sets of bootstrapping methods developed for different types of tests for metrics with different distributions.
“Quantile Bootstrap”: A Solution for Understanding Movement in Parts of a Distribution
One class of methods, which we call quantile bootstrapping, was developed to understand movement in certain parts of metric distributions. Often times simply moving the mean or median of a metric is not the experimenter’s goal. We need to determine whether new encodes create a statistically significant improvement in video quality for members who need it most. In other words, we need to evaluate whether new encodes move the lower tail of the video quality distribution and whether this movement was statistically significant or simply due to noise.
To quantify whether we moved specific sections of the distribution, we compare differences in quantile functions between the treatment and production experiences. These plots help experimenters quickly assess the magnitude of the difference between test experiences for all quantiles. But did this difference happen by chance? To measure statistical significance, we use an efficient bootstrapping procedure to create confidence intervals and p-values for all quantiles (with adjustments to account for multiple comparisons). The encoding team then understands the improvement in perceptual video quality for members who experience the worst video quality. If the p-values for the quantiles of interest are small, they can be assured that the newly developed encodes do in fact improve quality in the treatment experience. For more detail on how this methodology is implemented, you can read the following article on measuring practical and statistical significance.
The difference plot with shaded confidence intervals demonstrates a practically and statistically significant increase in video quality at the lowest percentiles of the distribution
“Rare Event Bootstrap”: A Solution for Metrics with Non-Standard Distributions
In streaming experiments, we care a lot about changes in the frequency of rare events. One such example is how many rebuffers — the spinning wheels that interrupt our members’ playback experience — occur per hour. Since the service generally works quite well, most streaming sessions do not have rebuffers. However when a rebuffer does occur, it is very disruptive to the member. Many experiments aim to evaluate whether we have reduced rebuffers per hour for some members, and in all streaming experiments we check that the rebuffer rate has not increased.
To understand differences in metrics that occur rarely, we developed a class of methods we call the rare event bootstrap. Summary statistics such as means and medians would be insufficient for this class, since they would be calculated from member-level aggregates (as this is the grain of randomization in our experiments). These are unsatisfactory for a few reasons:
If a member streamed for a very short period of time but had a single rebuffer, their rebuffers per hour value would be extremely large due to the small denominator. A mean over the member-level rates would then be dominated by these outlying values.
Since these events occur infrequently, the distribution of rates over members consists of almost all zeros and a small fraction of non-zero values. The median is not a useful statistic as even large changes to the overall rebuffer rate would not result in the median changing.
This makes a standard nonparametric Mann-Whitney U test ineffective as well.
To account for these properties of rate metrics that are often zero, we develop a custom technique that compares rates for the control experience to the rate for each treatment experience. In the previous section, quantile bootstrap analysis, we had “one vote per member” since member-level aggregates do not encounter the two issues above. In the rare event analysis, we weigh each hour (or session) equally instead. We do so by summing the rebuffers across all accounts, summing the total hours of content viewed across all accounts, and then dividing the two for both the production and treatment experience.
To assess whether this difference is statistically significant, we need to quantify the uncertainty around our point estimates. We resample with replacement the pairs of {rebuffers, view hours} per member and then sum each to form the ratio. The new datasets are used to derive confidence intervals and compute p-values. When generating new datasets, we must resample a two-vector pair to maintain the member-level information, as this is our grain of randomization. Resampling the member’s ratio of rebuffers per hour will lose information about the viewing hours. For example, zero rebuffers in one second versus zero rebuffers in two hours are very different member experiences. Had we only resampled the ratio, both of those would have been 0 and we would not maintain meaningful differences between them.
The treatment experience provided a statistically significant reduction in rebuffer rate
Taken together, the two methods give a fairly complete view of the QoE metric movements in an A/B test.
A Solution That Scales: An Effective Compression Mechanism
Our next challenge was to adapt these bootstrapping methods to work at the scale required to power all streaming QoE experiments. This means precomputing results for all tests, all QoE metrics, and all commonly compared segments of the population (e.g. for all device types in the test). Our method for doing so focuses on reducing the total number of rows in the dataset while maintaining accurate results compared to using the full dataset.
After trying different compression strategies, we decided to move forward with an n-tile bucketing approach, consisting of the following steps
Sort the data from smallest to largest value
Split it into n evenly sized buckets by count
Calculate a summary statistic for each bucket (e.g. mean or median)
Consolidate all the rows from a single bucket into one row, keeping track only of the summary statistic and the total number of original rows we consolidated (the ‘count’)
Once the bucketing is complete, the total number of rows in your dataset equals the number of buckets, with an additional column indicating the number of original data points in that bucket. The problem becomes of cardinality n, regardless of the allocation size.
For the ‘well behaved’ metrics where we are trying to understand movements in specific parts of the distribution, we group the original values into a fixed number of buckets. The number of buckets becomes the number of rows in the compressed dataset.
For a ‘well behaved’ metric, we create buckets with equal numbers of data points. The buckets can map to unequal portions of the PDF and CDF curves given the skew in our data.
When extending to metrics that occur rarely (like rebuffers per hour), we need to maintain a good approximation of the relationship between the numerator and the denominator. N-tiling the metric value itself (i.e. the ratio) will not work because it results in loss of information about the absolute scale.
In this case, we only apply the n-tiling approach to the denominator. We do not gain much reduction in data size by compressing the numerator as, in practice, we find that the number of unique numerator values is small. Take rebuffers per hour, for example, where the number of rebuffers a member has in the course of an experiment (the numerator) is usually 0, and a few members many have 1 to 5 rebuffers. The number of different values the numerator can take on is typically no more than 100. So we compress the denominators and persist the numerators.
We now have the same compression mechanism for both quantile and rare event bootstrapping, where the quantile bootstrap solution is a simpler special case of the 2D compression for rare event bootstrapping. Casting the quantile compression as a special case of the rare event approach simplifies the implementation.
An example of how an uncompressed dataset (left) reduces down to a compressed dataset (right) through n-tile bucketing
We explored the following evaluation criteria to identify the optimal number of buckets:
mean absolute difference in estimates when using the full versus compressed datasets
mean absolute difference in p-values when using the full versus compressed datasets
total number of p-values which agreed (both statistically significant or not) when using the full versus compressed datasets
In the end, we decided to set the number of buckets by requiring agreement in over 99.9 percent of p-values. Also, the estimates and p-values for both bootstrapping techniques were not practically different.
In practice, these compression techniques reduce the number of rows in the dataset by a factor of 1000 while maintaining accurate results! These innovations unlocked our potential to scale our methods to power the analyses for all streaming experimentation reports.
Impact on Experimentation at Netflix
The development of an effective data compression strategy completely changed the impact of our statistical tools for streaming experimentation at Netflix. Compressing the data allowed us to scale the number of computations to a point where we can now analyze the results for all metrics in all streaming experiments, across hundreds of population segments using our custom bootstrapping methods. The engineering teams are thrilled because we went from an ad-hoc, on demand, and slow solution outside of the experimentation platform to a paved-path, on-platform solution with lower latency and higher reliability.
The impact of this work reaches experimentation areas beyond streaming as well. Because of the new experimentation platform infrastructure, our methods can be incorporated into reports from other business areas. The learnings we have gained from our data compression research are also being leveraged as we think about scaling other statistical methods to run for high volumes of experimentation reports.