Quantcast
Viewing all 493 articles
Browse latest View live

Tracking down the Villains: Outlier Detection at Netflix

It’s 2 a.m. and half of our reliability team is online searching for the root cause of why Netflix streaming isn’t working. None of our systems are obviously broken, but something is amiss and we’re not seeing it. After an hour of searching we realize there is one rogue server in our farm causing the problem. We missed it amongst the thousands of other servers because we were looking for a clearly visible problem, not an insidious deviant.

In Netflix’s Marvel’s Daredevil, Matt Murdock uses his heightened senses to detect when a person’s actions are abnormal. This allows him to go beyond what others see to determine the non-obvious, like when someone is lying. Similar to this, we set out to build a system that could look beyond the obvious and find the subtle differences in servers that could be causing production problems. In this post we’ll describe our automated outlier detection and remediation for unhealthy servers that has saved us from countless hours of late-night heroics.

Shadows in the Glass

The Netflix service currently runs on tens of thousands of servers; typically less than one percent of those become unhealthy. For example, a server’s network performance might degrade and cause elevated request processing latency. The unhealthy server will respond to health checks and show normal system-level metrics but still be operating in a suboptimal state.

A slow or unhealthy server is worse than a down server because its effects can be small enough to stay within the tolerances of our monitoring system and be overlooked by an on-call engineer scanning through graphs, but still have a customer impact and drive calls to customer service. Somewhere out there a few unhealthy servers lurk among thousands of healthy ones.

Image may be NSFW.
Clik here to view.
NIWSErrors - hard to see outlier (can you spot).png
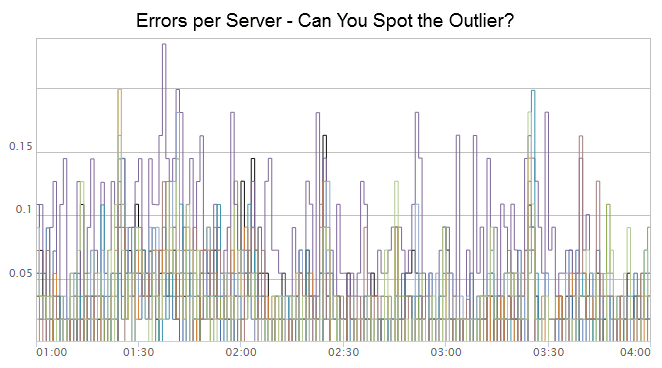
The purple line in the graph above has an error rate higher than the norm. All other servers have spikes but drop back down to zero, whereas the purple line consistently stays above all others. Would you be able to spot this as an outlier? Is there a way to use time series data to automatically find these outliers?

A very unhealthy server can easily be detected by a threshold alert. But threshold alerts require wide tolerances to account for spikes in the data. They also require periodic tuning to account for changes in access patterns and volume. A key step towards our goal of improving reliability is to automate the detection of servers that are operating in a degraded state but not bad enough to be detected by a threshold alert.
Image may be NSFW.
Clik here to view.
outlier-just-above-the-noise-caption.png

Finding a Rabbit in a Snowstorm

To solve this problem we use cluster analysis, which is an unsupervised machine learning technique. The goal of cluster analysis is to group objects in such a way that objects in the same cluster are more similar to each other than those in other clusters. The advantage of using an unsupervised technique is that we do not need to have labeled data, i.e., we do not need to create a training dataset that contains examples of outliers. While there are many different clustering algorithms, each with their own tradeoffs, we use Density-Based Spatial Clustering of Applications with Noise (DBSCAN) to determine which servers are not performing like the others.

How DBSCAN Works

DBSCAN is a clustering algorithm originally proposed in 1996 by Martin Ester, Hans-Peter Kriegel, Jörg Sander and Xiaowei Xu. This technique iterates over a set of points and marks as clusters points that are in regions with many nearby neighbors, while marking those in lower density regions as outliers. Conceptually, if a particular point belongs to a cluster it should be near lots of other points as measured by some distance function. For an excellent visual representation of this see Naftali Harris’ blog post on visualizing DBSCAN clustering.

How We Use DBSCAN

To use server outlier detection, a service owner specifies a metric which will be monitored for outliers. Using this metric we collect a window of data from Atlas, our primary time series telemetry platform. This window is then passed to the DBSCAN algorithm, which returns the set of servers considered outliers. For example, the image below shows the input into the DBSCAN algorithm; the red highlighted area is the current window of data:
Image may be NSFW.
Clik here to view.
In addition to specifying the metric to observe, a service owner specifies the minimum duration before a deviating server is considered an outlier. After detection, control is handed off to our alerting system that can take any number of actions including:

  • email or page a service owner
  • remove the server from service without terminating it
  • gather forensic data for investigation
  • terminate the server to allow the auto scaling group to replace it

Parameter Selection

DBSCAN requires two input parameters for configuration; a distance measure and a minimum cluster size. However, service owners do not want to think about finding the right combination of parameters to make the algorithm effective in identifying outliers. We simplify this by having service owners define the current number of outliers, if there are any, at configuration time. Based on this knowledge, the distance and minimum cluster size parameters are selected using simulated annealing. This approach has been effective in reducing the complexity of setting up outlier detection and has facilitated adoption across multiple teams; service owners do not need to concern themselves with the details of the algorithm.

Into the Ring

To assess the effectiveness of our technique we evaluated results from a production service with outlier detection enabled. Using one week’s worth of data, we manually determined if a server should have been classified as an outlier and remediated. We then cross-referenced these servers with the results from our outlier detection system. From this, we were able to calculate a set of evaluation metrics including precision, recall, and f-score:

Server Count
Precision
Recall
F-score
1960
93%
87%
90%

These results illustrate that we cannot perfectly distill outliers in our environment but we can get close. An imperfect solution is entirely acceptable in our cloud environment because the cost of an individual mistake is relatively low. Erroneously terminating a server or pulling one out of service has little to no impact because it will be immediately replaced with a fresh server.  When using statistical solutions for auto remediation we must be comfortable knowing that the system will not be entirely accurate; an imperfect solution is preferable to no solution at all.

The Ones We Leave Behind

Our current implementation is based on a mini-batch approach where we collect a window of data and use this to make a decision. Compared to a real-time approach, this has the drawback that outlier detection time is tightly coupled to window size: too small and you’re subject to noise, too big and your detection time suffers. Improved approaches could leverage advancements in real-time stream processing frameworks such as Mantis (Netflix's Event Stream Processing System) and Apache Spark Streaming. Furthermore, significant work has been conducted in the areas of data stream mining and online machine learning. We encourage anyone looking to implement such a system to consider using online techniques to minimize time to detect.

Parameter selection could be further improved with two additional services: a data tagger for compiling training datasets and a model server capable of scoring the performance of a model and retraining the model based on an appropriate dataset from the tagger. We’re currently tackling these problems to allow service owners to bootstrap their outlier detection by tagging data (a domain in which they are intimately familiar) and then computing the DBSCAN parameters (a domain that is likely foreign) using a bayesian parameter selection technique to optimize the score of the parameters against the training dataset.

World on Fire

As Netflix’s cloud infrastructure increases in scale, automating operational decisions enables us to improve availability and reduce human intervention. Just as Daredevil uses his suit to amplify his fighting abilities, we can use machine learning and automated responses to enhance the effectiveness of our site reliability engineers and on-call developers.  Server outlier detection is one example of such automation, other examples include Scryer and Hystrix. We are exploring additional areas to automate such as:

  • Analysis and tuning of service thresholds and timeouts
  • Automated canary analysis
  • Shifting traffic in response to region-wide outages
  • Automated performance tests that tune our autoscaling rules

These are just a few example of steps towards building self-healing systems of immense scale. If you would like to join us in tackling these kinds of challenges, we arehiring!

Java in Flames

Java mixed-mode flame graphs provide a complete visualization of CPU usage and have just been made possible by a new JDK option: -XX:+PreserveFramePointer. We've been developing these at Netflix for everyday Java performance analysis as they can identify all CPU consumers and issues, including those that are hidden from other profilers.

Example
This shows CPU consumption by a Java process, both user- and kernel-level, during a vert.x benchmark:
Image may be NSFW.
Clik here to view.

Click to zoom (SVG, PNG). Showing all CPU usage with Java context is amazing and useful. On the top right you can see a peak of kernel code (colored red) for performing a TCP send (which often leads to a TCP receive while handling the send). Beneath it (colored green) is the Java code responsible. In the middle (colored green) is the Java code that is running on-CPU. And in the bottom left, a small yellow tower shows CPU time spent in GC.

We've already used Java flame graphs to quantify performance improvements between frameworks (Tomcat vs rxNetty), which included identifying time spent in Java code compilation, the Java code cache, other system libraries, and differences in kernel code execution. All of these CPU consumers were invisible to other Java profilers, which only focus on the execution of Java methods.

Flame Graph Interpretation
If you are new to flame graphs: The y axis is stack depth, and the x axis spans the sample population. Each rectangle is a stack frame (a function), where the width shows how often it was present in the profile. The ordering from left to right is unimportant (the stacks are sorted alphabetically).

In the previous example, color hue was used to highlight different code types: green for Java, yellow for C++, and red for system. Color intensity was simply randomized to differentiate frames (other color schemes are possible).

You can read the flame graph from the bottom up, which follows the flow of code from parent to child functions. Another way is top down, as the top edge shows the function running on CPU, and beneath it is its ancestry. Focus on the widest functions, which were present in the profile the most. See the CPU flame graphs page for more about interpretation, and Brendan's USENIX/LISA'13 talk (video).

The Problem with Profilers
In order to generate flame graphs, you need a profiler that can sample stack traces. There have historically been two types of profilers used on Java:
  • System profilers: such as Linux perf_events, which can profile system code paths, including libjvm internals, GC, and the kernel, but not Java methods.
  • JVM profilers: such as hprof, Lightweight Java Profiler (LJP), and commercial profilers. These show Java methods, but not system code paths.
To understand all types of CPU consumers, we previously used both types of profilers, creating a flame graph for each. This worked – sort of. While all CPU consumers could be seen, Java methods were missing from the system profile, which was crucial context we needed.

Ideally, we would have one flame graph that shows it all: system and Java code together.

A system profiler like Linux perf_events should be well suited to this task as it can interrupt any software asynchronously and capture both user- and kernel-level stacks. However, system profilers don't work well with Java. The problem is shown by the flame graph on the right. The Java stacks and method names are missing.

There were two specific problems to solve:
  1. The JVM compiles methods on the fly (just-in-time: JIT), and doesn't expose a symbol table for system profilers.
  2. The JVM also uses the frame pointer register on x86 (RBP on x86-64) as a general-purpose register, breaking traditional stack walking.
Brendan summarized these earlier this year in his Linux Profiling at Netflix talk for SCALE. Fortunately, there was already a fix for the first problem.

Fixing Symbols
In 2009, Linux perf_events added JIT symbol support, so that symbols from language virtual machines like the JVM could be inspected. To use it, your application creates a /tmp/perf-PID.map text file, which lists symbol addresses (in hex), sizes, and symbol names. perf_events looks for this file by default and, if found, uses it for symbol translations.

Java can create this file using perf-map-agent, an open source JVMTI agent written by Johannes Rudolph. The first version needed to be attached on Java startup, but Johannes enhanced it to attach later on demand and take a symbol dump. That way, we only load it if we need it for a profile. Thanks, Johannes!

Since symbols can change slightly during the profile (we’re typically profiling for 30 or 60 seconds), a symbol dump may include stale symbols. We’ve looked at taking two symbol dumps, before and after the profile, to highlight any such differences. Another approach in development involves a timestamped symbol log to ensure that all translations are accurate (although this requires always-on logging of symbols). So far symbol churn hasn’t been a large problem for us, after Java and JIT have “warmed up” and symbol churn is minimal (this can take a few minutes, given sufficient load). We do bear it in mind when interpreting flame graphs.

Fixing Frame Pointers
For many years the gcc compiler has reused the frame pointer as a compiler optimization, breaking stack traces. Some applications compile with the gcc option -fno-omit-frame-pointer, to preserve this type of stack walking, however, the JVM had no equivalent option. Could the JVM be modified to support this?

Brendan was curious to find out, and hacked a working prototype for OpenJDK. It involved dropping RBP from eligible register pools, eg (diff):
--- openjdk8clean/hotspot/src/cpu/x86/vm/x86_64.ad      2014-03-04 02:52:11.000000000 +0000
+++ openjdk8/hotspot/src/cpu/x86/vm/x86_64.ad 2014-11-08 01:10:49.686044933 +0000
@@ -166,10 +166,9 @@
// 3) reg_class stack_slots( /* one chunk of stack-based "registers" */ )
//

-// Class for all pointer registers (including RSP)
+// Class for all pointer registers (including RSP, excluding RBP)
reg_class any_reg(RAX, RAX_H,
RDX, RDX_H,
- RBP, RBP_H,
RDI, RDI_H,
RSI, RSI_H,
RCX, RCX_H,
... and then fixing the function prologues to store the stack pointer (rsp) into the frame pointer (base pointer) register (rbp):
--- openjdk8clean/hotspot/src/cpu/x86/vm/macroAssembler_x86.cpp 2014-03-04 02:52:11.000000000 +0000
+++ openjdk8/hotspot/src/cpu/x86/vm/macroAssembler_x86.cpp 2014-11-07 23:57:11.589593723 +0000
@@ -5236,6 +5236,7 @@
// We always push rbp, so that on return to interpreter rbp, will be
// restored correctly and we can correct the stack.
push(rbp);
+ mov(rbp, rsp);
// Remove word for ebp
framesize -= wordSize;
It worked. Here are the before and after flame graphs. Brendan posted it, with example flame graphs, to the hotspot compiler devs mailing list. This feature request became JDK-8068945 for JDK9 and JDK-8072465 for JDK8.

Fixing this properly involved a lot more work (see discussions in the bugs and mailing list). Zoltán Majó, of Oracle, took this on and rewrote the patch. After testing, it was finally integrated into the early access releases of both JDK9 and JDK8 (JDK8 update 60 build 19), as the new JDK option: -XX:+PreserveFramePointer.

Many thanks to Zoltán, Oracle, and the other engineers who helped get this done!

Since use of this mode disables a compiler optimization, it does decrease performance slightly. We've found in tests that this costs between 0 and 3% extra CPU, depending on the workload. See JDK-8068945 for some additional benchmarking details. There are also other techniques for walking stacks, some with zero run time cost to make available, however, there are other downsides with these approaches.

Instructions
The following steps describe how these flame graphs can be created. We’re working on improving and automating these steps using Vector (more on that in a moment).

1. Install software
There are four components to install:

Linux perf_events
This is the standard Linux profiler, aka “perf” after its front end, and is included in the Linux source (tools/perf). Try running perf help to see if it is installed; if not, your distro may suggest how to get it, usually by adding a perf-tools-common package.

Java 8 update 60 build 19 (or newer)
This includes the frame pointer patch fix (JDK-8072465), which is necessary for Java stack profiling. It is currently released as early access (built from OpenJDK).

perf-map-agent
This is a JVMTI agent that provides Java symbol translation for perf_events is on github. Steps to build this typically involve:
apt-get install cmake
export JAVA_HOME=/path-to-your-new-jdk8
git clone --depth=1 https://github.com/jrudolph/perf-map-agent
cd perf-map-agent
cmake .
make
The current version of perf-map-agent can be loaded on demand, after Java is running.
WARNING: perf-map-agent is experimental code – use at your own risk, and test before use!

FlameGraph
This is some Perl software for generating flame graphs. It can be fetched from github:
git clone --depth=1 https://github.com/brendangregg/FlameGraph
This contains stackcollapse-perf.pl, for processing perf_events profiles, and flamegraph.pl, for generating the SVG flame graph.

2. Configure Java
Java needs to be running with the -XX:+PreserveFramePointer option, so that perf_events can perform frame pointer stack walks. As mentioned earlier, this can cost some performance, between 0 and 3% depending on the workload.

3a. Generate System Wide Flame Graphs
With this software and Java running with frame pointers, we can profile and generate flame graphs.

For example, taking a 30-second profile at 99 Hertz (samples per second) of all processes, then caching symbols for Java PID 1690, then generating a flame graph:
sudo perf record -F 99 -a -g -- sleep 30
java -cp attach-main.jar:$JAVA_HOME/lib/tools.jar net.virtualvoid.perf.AttachOnce 1690 # run as same user as java
sudo chown root /tmp/perf-*.map
sudo perf script | stackcollapse-perf.pl | \
flamegraph.pl --color=java --hash > flamegraph.svg
The attach-main.jar file is from perf-map-agent, and stackcollapse-perf.pl and flamegraph.pl are from FlameGraph. Specify their full paths unless they are in the current directory.

These steps address some quirky behavior involving user permissions: sudo perf script only reads symbol files the current user (root) owns, and, perf-map-agent creates files with the same user ownership as the Java process, which for us is usually non-root. This means we have to change the ownership to root for the symbol file, and then run perf script.

With jmaps
Dealing with symbol files has become a chore, so we’ve been automating it. Here’s one example: jmaps, which can be used like so:
sudo perf record -F 99 -a -g -- sleep 30; sudo jmaps
sudo perf script | stackcollapse-perf.pl | \
flamegraph.pl --color=java --hash > flamegraph.svg
jmaps creates symbol files for all Java processes, with root ownership. You may want to write a similar “jmaps” helper for your environment (our jmaps example is unsupported). Remember to clean up the /tmp symbol files when you no longer need them!

3b. Generate By-Process Flame Graphs
The previous procedure grouped Java processes together. If it is important to separate them (and, on some of our instances, it is), you can modify the procedure to generate a by-process flame graph. Eg (with jmaps):
sudo perf record -F 99 -a -g -- sleep 30; sudo jmaps
sudo perf script -f comm,pid,tid,cpu,time,event,ip,sym,dso,trace | \
stackcollapse-perf.pl --pid | \
flamegraph.pl --color=java --hash > flamegraph.svg
The output of stackcollapse-perf.pl formats each stack as a single line, and is great food for grep/sed/awk. For the flamegraph at the top of this post, we used the above procedure, and added “| grep java-339” before the “| flamegraph.pl”, to isolate that one process. You could also use a “| grep -v cpu_idle”, to exclude the kernel idle threads.

Missing Frames
If you start using these flame graphs, you’ll notice that many Java frames (methods) are missing. Compared to the jstack(1) command line tool, the stacks seen in the flame graph look perhaps one third as deep, and are missing many frames. This is because of inlining, combined with this type of profiling (frame pointer based) which only captures the final executed code.

This hasn’t been much of a problem so far: even when many frames are missing, enough remain that we can figure out what’s going on. We’ve also experimented with reducing the amount of inlining, eg, using -XX:InlineSmallCode=500, to increase the number of frames in the profile. In some cases this even improves performance slightly, as the final compiled instruction size is reduced, fitting better into the processor caches (we confirmed this using perf_events separately).

Another approach is to use JVMTI information to unfold the inlined symbols. perf-map-agent has a mode to do this; however, Min Zhou from LinkedIn has experienced Java crashes when using this, which he has been fixing in his version. We’ve not seen these crashes (as we rarely use that mode), but be warned.

Vector
The previous steps for generating flame graphs are a little tedious. As we expect these flame graphs will become an everyday tool for Java developers, we’ve looked at making them as easy as possible: a point-and-click interface. We’ve been prototyping this with our open source instance analysis tool: Vector.

Vector was described in more details in a previous techblog post. It provides a simple way for users to visualize and analyze system and application-level metrics in near real-time, and flame graphs is a great addition to the set of functionalities it already provides.

We tried to keep the user interaction as simple as possible. To generate a flame graph, you connect Vector to the target instance, add the flame graph widget to the dashboard, then click the generate button. That's it!

Behind the scenes, Vector requests a flame graph from a custom instance agent that we developed, which also supplies Vector's other metrics. Vector checks the status of this request while fetching and displaying other metrics, and displays the flame graph when it is ready.

Our custom agent is not generic enough to be used by everyone yet (it depends on the Netflix environment), so we have yet to open-source it. If you're interested in testing or extending it, reach out to us.

Future Work
We have some enhancements planned. One is for regression analysis, by automatically collecting flame graphs over different days and generating flame graph differentials for them. This will help us quickly understand changes in CPU usage due to software changes.

Apart from CPU profiling, perf_events can also trace user- and kernel-level events, including disk I/O, networking, scheduling, and memory allocation. When these are synchronously triggered by Java, a mixed-mode flame graph will show the code paths that led to these events. A page fault mixed-mode flame graph, for example, can be used to show which Java code paths led to an increase in main memory usage (RSS).

We also want to develop enhancements for flame graphs and Vector, including real time updates. For this to work, our agent will collect perf_events directly and return a data structure representing the partial flame graph to Vector with every check. Vector, with this information, will be able to assemble the flame graph in real time, while the profile is still being collected. We are also investigating using D3 for flame graphs, and adding interactivity improvements.

Other Work
Twitter have also explored making perf_events and Java work better together, which Kaushik Srenevasan summarized in his Tracing and Profiling talk from OSCON 2014 (slides). Kaushik showed that perf_events has much lower overhead when compared to some other Java profilers, and included a mixed-mode stack trace from perf_events. David Keenan from Twitter also described this work in his Twitter-Scale Computing talk (video), as well as summarizing other performance enhancements they have been making to the JVM.

At Google, Stephane Eranian has been working on perf_events and Java as well and has posted a patch series that supports a timestamped JIT symbol transaction log from Java for accurate symbol translation, solving the stale symbol problem. It’s impressive work, although a downside with the logging technique may be the performance cost of always logging symbols even if a profiler is never used.

Conclusion
CPU mixed-mode flame graphs help identify and quantify all CPU consumers. They show the CPU time spent in Java methods, system libraries, and the kernel, all in one visualization. This reveals CPU consumers that are invisible to other profilers, and have so far been used to identify issues and explain performance changes between software versions.

These mixed-mode flame graphs have been made possible by a new option in the JVM: -XX:+PreserveFramePointer, available in early access releases. In this post we described how these work, the challenges that were addressed, and provided instructions for their generation. Similar visibility for Node.js was described in our earlier post: Node.js in Flames.

by Brendan Gregg and Martin Spier

Tuning Tomcat For A High Throughput, Fail Fast System

Problem

Netflix has a number of high throughput, low latency mid tier services. In one of these services, it was observed that in case there is a huge surge in traffic in a very short span of time, the machines became cpu starved and would become unresponsive. This would lead to a bad experience for the clients of this service. They would get a mix of read and connect timeouts. Read timeouts can be particularly bad if the read timeouts are set to be very high. The client machines will wait to hear from the server for a long time. In case of SOA, this can lead to a ripple effect as the clients of these clients will also start getting read timeouts and all services can slow down. Under normal circumstances, the machines had ample amount of cpu free and the service was not cpu intensive. So, why does this happen? In order to understand that, let's first look at the high level stack for this service. The request flow would look like this


Image may be NSFW.
Clik here to view.


On simulating the traffic surge in the test environment it was found that the reason for cpu starvation was improper apache and tomcat configuration. On a sudden increase in traffic, multiple apache workers became busy and a very large number of tomcat threads also got busy. There was a huge jump in system cpu as none of the threads could do any meaningful work since most of the time cpu would be context switching.

Solution

Since this was a mid tier service, there was not much use of apache. So, instead of tuning two systems (apache and tomcat), it was decided to simplify the stack and get rid of apache. To understand why too many tomcat threads got busy, let's understand the tomcat threading model.

High Level Threading Model for Tomcat Http Connector

Tomcat has an acceptor thread to accept connections. In addition, there is a pool of worker threads which do the real work. The high level flow for an incoming request is:
  1. TCP handshake between OS and client for establishing a connection. Depending on the OS implementation there can be a single queue for holding the connections or there can be multiple queues. In case of multiple queues, one holds incomplete connections which have not yet completed the tcp handshake. Once completed, connections are moved to the completed connection queue for consumption by the application. "acceptCount" parameter in tomcat configuration is used to control the size of these queues.
  2. Tomcat acceptor thread accepts connections from the completed connection queue.
  3. Checks if a worker thread is available in the free thread pool. If not, creates a worker thread if the number of active threads < maxThreads. Else wait for a worker thread to become free.
  4. Once a free worker thread is found, acceptor thread hands the connection to it and gets back to listening for new connections.
  5. Worker thread does the actual job of reading input from the connection, processing the request and sending the response to the client. If the connection was not keep alive then it closes the connection and places itself in the free thread pool. For a keep alive connection, waits for more data to be available on the connection. In case data does not become available until keepAliveTimeout, closes the connection and makes itself available in the free thread pool.
In case the number of tomcat threads and acceptCount values are set to be too high, a sudden increase in traffic will fill up the OS queues and make all the worker threads busy. When more requests than that can be handled by the system are sent to the machines, this "queuing" of requests is inevitable and will lead to increased busy threads, causing cpu starvation eventually.  Hence, the crux of the solution is to avoid too much queuing of requests at multiple points (OS and tomcat threads) and fail fast (return http status 503) as soon the application's maximum capacity is reached. Here is a recommendation for doing this in practice:

Fail fast in case the system capacity for a machine is hit

Estimate the number of threads expected to be busy at peak load. If the server responds back in 5 ms on avg for a request, then a single thread can do a max of 200 requests per second (rps). In case the machine has a quad core cpu, it can do max 800 rps. Now assume that 4 requests (since the assumption is that the machine is a quad core) come in parallel and hit the machine. This will make 4 worker threads busy. For the next 5 ms all these threads will be busy. The total rps to the system is the max value of 800, so in next 5 ms, 4 more requests will come and make another 4 threads busy. Subsequent requests will pick up one of the already busy threads which has become free. So, on an average there should not be more than 8 threads busy at 800 rps. The behavior will be a little different in practice because all system resources like cpu will be shared. Hence one should experiment for the total throughput the system can sustain and do a calculation for expected number of busy threads. This will provide a base line for the number of threads needed to sustain peak load. In order to provide some buffer lets more than triple the number of max threads needed to 30. This buffer is arbitrary and can be further tuned if needed. In our experiments we used a slightly more than 3 times buffer and it worked well.

Track the number of active concurrent requests in memory and use it for fast failing. If the number of concurrent requests is near the estimated active threads (8 in our example) then return an http status code of 503. This will prevent too many worker threads becoming busy because once the peak throughput is hit, any extra threads which become active will be doing a very light weight job of returning 503 and then be available for further processing.

Configure Operating System parameters

The acceptCount parameter for tomcat dictates the length of the queues at the OS level for completing tcp handshake operations (details are OS specific). It's important to tune this parameter, otherwise one can have issues with establishing connections to the machine or it can lead to excessive queuing of connections in OS queues which will lead to read timeouts. The implementation details of handling incomplete and complete connections vary across OS. There can be a single queue of connections or multiple queues for incomplete and complete connections (please refer to the References section for details). So, a nice way to tune the acceptCount parameter is to start with a small value and keep increasing it unless the connection errors get removed.

Having too large a value for acceptCount means that the incoming requests can get accepted at the OS level. However, if the incoming rps is more than what a machine can handle, all the worker threads will eventually become busy and then the acceptor thread will wait for a worker thread to become free. More requests will continue to pile up in the OS queues since acceptor thread will consume them only when a worker thread becomes available. In the worst case, these requests will timeout while waiting in the OS queues, but will still be processed by the server once they get picked by the tomcat's acceptor thread. This is a complete waste of processing resources as a client will never receive any response.

If the value of acceptCount is too small, then in case of a high rps there will not be enough space for OS to accept connections and make it available for the acceptor thread. In this case, connect timeout errors will be returned to the client way below the actual throughput for the server is reached.

Hence experiment by starting with a small value like 10 for acceptCount and keep increasing it until there are are no connection errors from the server.

On doing both the changes above, even if all the worker threads become busy in the worst case, the servers will not be cpu starved and will be able to do as much work as possible (max throughput).

Other considerations

As explained above, each incoming connection is ultimately handled to a worker tomcat thread. In case http keep alive is turned on, a worker thread will continue to listen on a connection and will not be available in the free thread pool. So, if the clients are not smart to close the connection once it's not being actively used, the server can very easily run out of worker threads. If keep alive is turned on then one has to size the server farm by keeping this constraint in mind.

Alternatively, if keep alive is turned off then one does not have to worry about the problem of inactive connections using worker threads. However, in this case on each call one has to pay the price of opening and closing the connection. Further, this will also create a lot of sockets in the TIME_WAIT state which can put pressure on the servers.

Its best to pick the choice based on the use cases for the application and to test the performance by running experiments.

Results

Multiple experiments were run with different configurations. The results are shown below. The dark blue line is the original configuration with apache and tomcat. All the other are different configurations for the stack with only tomcat

Image may be NSFW.
Clik here to view.

Throughput
Note the drop after a sustained period of traffic higher than what can be served by server.

Image may be NSFW.
Clik here to view.

Busy Apache Workers

Image may be NSFW.
Clik here to view.

Idle cpu
Note that the original configuration got so busy that it was not even able to publish the stats for idle cpu on a continuous basis. The stats were published (valued 0) for the base configuration intermittently as highlighted in the red circles

Image may be NSFW.
Clik here to view.

Server average latency to process a request

Note

Its possible to achieve the same results by tuning the combination of apache and tomcat to work together. However, since there was not much use of apache for our service, we found the above model simpler with one less moving part. It's best to make choices by a combination of understanding the system and use of experimentation and testing in a real-world environment to verify hypothesis.

References

  1. https://books.google.com/books/about/UNIX_Network_Programming.html?id=ptSC4LpwGA0C&source=kp_cover&hl=en
  2. http://www.sean.de/Solaris/soltune.html
  3. https://tomcat.apache.org/tomcat-7.0-doc/config/http.html
  4. http://grepcode.com/project/repository.springsource.com/org.apache.coyote/com.springsource.org.apache.coyote/

Acknowledgment

I would like to thank Mohan Doraiswamy for his suggestions in this effort.

Netflix at Velocity 2015: Linux Performance Tools

There are many performance tools nowadays for Linux, but how do they all fit together, and when do we use them? At Velocity 2015, I gave a 90 minute tutorial on Linux performance tools. I’ve spoken on this topic before, but given a 90 minute time slot I was able to include more methodologies, tools, and live demonstrations, making it the most complete tour of the topic I’ve done. The video and slides are below.

In this tutorial I summarize traditional and advanced performance tools, including: top, ps, vmstat, iostat, mpstat, free, strace, tcpdump, netstat, nicstat, pidstat, swapon, lsof, sar, ss, iptraf, iotop, slaptop, pcstat, tiptop, rdmsr, lmbench, fio, pchar, perf_events, ftrace, SystemTap, ktap, sysdig, and eBPF; and reference many more. I also include updated tools diagrams for observability, sar, benchmarking, and tuning (including the image above).

This tutorial can be shared with a wide audience – anyone working on Linux systems – as a free crash course on Linux performance tools. I hope people enjoy it and find it useful. Here's the playlist.

Part 1 (youtube) (54 mins):

Part 2 (youtube) (45 mins):

Slides (slideshare):

At Netflix, we have Atlas for cloud-wide monitoring, and Vector for on-demand instance analysis. Much of the time we don't need to login to instances directly, but when we do, this tutorial covers the tools we use.

Thanks to O'Reilly for hosting a great conference, and those who attended.

If you are passionate about the content in this tutorial, we're hiring, particularly for senior SREs and performance engineers: see Netflix jobs!

Making Netflix.com Faster

by Kristofer Baxter

Simply put, performance matters. We know members want to immediately start browsing or watching their favorite content and have found that faster startup leads to more satisfying usage. So, when building the long-awaited update to netflix.com, the Website UI Engineering team made startup performance a first tier priority.

The impact of this effort netted a 70% reduction in startup time, and was focused in three key areas:

  1. Server and Client Rendering
  2. Universal JavaScript
  3. JavaScript Payload Reductions

Server and Client Rendering

The netflix.com legacy website stack had a hard separation between server markup and client enhancement. This was primarily due to the different programming languages used in each part of our application. On the server, there was Java with Tomcat, Struts and Tiles. On the browser client, we enhanced server-generated markup with JavaScript, primarily via jQuery.

This separation led to undesirable results in our startup time. Every time a visitor came to any page on netflix.com our Java tier would generate the majority of the response needed for the entire page's lifetime and deliver it as HTML markup. Often, users would be waiting for the generation of markup for large parts of the page they would never visit.

Our new architecture renders only a small amount of the page's markup, bootstrapping the client view. We can easily change the amount of the total view the server generates, making it easy to see the positive or negative impact. The server requires less data to deliver a response and spends less time converting data into DOM elements. Once the client JavaScript has taken over, it can retrieve all additional data for the remainder of the current and future views of a session on demand. The large wins here were the reduction of processing time in the server, and the consolidation of the rendering into one language.

We find the flexibility afforded by server and client rendering allows us to make intelligent choices of what to request and render in the server and the client, leading to a faster startup and a smoother transition between views.

Universal JavaScript

In order to support identical rendering on the client and server, we needed to rethink our rendering pipeline. Our previous architecture's separation between the generation of markup on the server and the enhancement of it on the client had to be dropped.

Three large pain points shaped our new Node.js architecture:

  1. Context switching between languages was not ideal.
  2. Enhancement of markup required too much direct coupling between server-only code generating markup and the client-only code enhancing it.
  3. We’d rather generate all our markup using the same API.

There are many solutions to this problem that don't require Universal JavaScript, but we found this lesson was most appropriate: When there are two copies of the same thing, it's fairly easy for one to be slightly different than the other. Using Universal JavaScript means the rendering logic is simply passed down to the client.

Node.js and React.js are natural fits for this style of application. With Node.js and React.js, we can render from the server and subsequently render changes entirely on the client after the initial markup and React.js components have been transmitted to the browser. This flexibility allows for the application to render the exact same output independent of the location of the rendering. The hard separation is no longer present and it's far less likely for the server and client to be different than one another.

Without shared rendering logic we couldn't have realized the potential of rendering only what was necessary on startup and everything else as data became available.

Reduce JavaScript Payload Impact

Building rich interactive experiences on the web often translates into a large JavaScript payload for users. In our new architecture, we placed significant emphasis on pruning large dependencies we can knowingly replace with smaller modules and delivering JavaScript only applicable for the current visitor.

Many of the large dependencies we relied on in the legacy architecture didn't apply in the new one. We've replaced these dependencies in favor of newer, more efficient libraries. Replacing these libraries resulted in a much smaller JavaScript payload, meaning members need less JavaScript to start browsing. We know there is significant work remaining here, and we're actively working to trim our JavaScript payload down further.

Time To Interactive

In order to test and understand the impact of our choices, we monitor a metric we call time to interactive (tti).

Amount of time spent between first known startup of the application platform and when the UI is interactive regardless of view. Note that this does not require that the UI is done loading, but is the first point at which the customer can interact with the UI using an input device.

For applications running inside a web browser, this data is easily retrievable from the Navigation Timing API (where supported).

Work is Ongoing

We firmly believe high performance is not an optional engineering goal – it's a requirement for creating great user-experiences. We have made significant strides in startup performance, and are committed to challenging our industry’s best-practices in the pursuit of a better experience for our members.

Over the coming months we'll be investigating Service Workers, ASM.js, Web Assembly, and other emerging web standards to see if we can leverage them for a more performant website experience. If you’re interested in helping create and shape the next generation of performant web user-experiences apply here.

Introducing Surus and ScorePMML

Today we’re announcing a new Netflix-OSS project called Surus. Over the next year we plan to release a handful of our internal user defined functions (UDF’s) that have broad adoption across Netflix. The use cases for these functions are varied in nature (e.g. scoring predictive models, outlier detection, pattern matching, etc.) and together extend the analytical capabilities of big data.

The first function we’re releasing allows for efficient scoring of predictive models in Apache Pig using Predictive Modeling Markup Language. PMML is an open source standard that supports a concise representation of predictive models in XML and hence the name of the new function, ScorePMML.

ScorePMML


At Netflix, we use predictive models everywhere. Although the applications for each model are different, the process by which each of these predictive models is built and deployed is consistent. The process usually looks like this:

  1. Someone proposes an idea and builds a model on “small” data
  2. We decide to “scale-up” the prototype to see how well the model generalizes to a larger dataset
  3. We may eventually put the model into “production”

At Netflix, we have different tools for each step above. When scoring data in our hadoop environment, we noticed a proliferation of custom scoring approaches operating in steps two and three. This implementation of custom scoring approaches added overhead as individual developers migrated models through the process. Our solution was to adopt PMML as a standard way to represent model output and to write ScorePMML as a UDF for scoring PMML files at scale.

ScorePMML aligns Netflix predictive modeling capabilities around the open-source PMML standard. By leveraging the open-source standard, we enable a flexible and consistent representation of predictive models for each of the steps mentioned above. By using the same PMML representation of the predictive model at each step in the modeling process, we save time/money by reducing both the risk and cost of custom code. PMML provides an effective foundation to iterate quickly for the modeling methods it supports. Our data scientists have started adopting ScorePMML where it allows them to iterate and deploy models more effectively than the legacy approach.

An Example


Now for the practical part. Let’s imagine that you’re building a model in R. You might do something like this….

# Required Dependencies
require(randomForest)
require(gbm)
require(pmml)
require(XML)
data(iris)

# Column Names must NOT contain periods
names(iris) <- gsub("\\.","_",tolower(names(iris)))

# Build Models
iris.rf  <- randomForest(Species ~ ., data=iris, ntree=5)
iris.gbm <- gbm(Species ~ ., data=iris, n.tree=5)

# Convert to pmml
# Output to File
saveXML(pmml(iris.rf) ,file="~/iris.rf.xml")
saveXML(pmml(iris.gbm, n.trees=5),file="~/iris.gbm.xml")

And, now let’s say that you want to score 100 billion rows…

REGISTER '~/scoring.jar';

DEFINE pmmlRF  com.netflix.pmml.ScorePMML('~/iris.rf.xml');
DEFINE pmmlGBM com.netflix.pmml.ScorePMML('~/iris.gbm.xml');

-- LOAD Data
iris = load '~/iris.csv' using PigStorage(',') as
      (sepal_length,sepal_width,petal_length,petal_width,species);

-- Score two models in one pass over the data
scored = foreach iris generate pmmlRF(*) as RF, pmmlGBM(*) as GBM;
dump scored;

That’s how easy it should be.

There are a couple of things you should think about though before trying to score 100 billion records in Pig.  

  • We throw a Pig FrontendException when the Pig/Hive data types and column names don’t match the data types and column names in PMML. This means that you don’t need to wait for the Hadoop MR job to start before getting the feedback that something is wrong.
  • The ScorePMML constructor accepts local or remote file locations. This means that you can reference an HDFS or S3 path, or you can reference a local path (see the example above).
  • We’ve made scoring multiple models in parallel trivial. Furthermore, models are only read into memory once, so there isn’t a penalty when processing multiple models at the same time.
  • When scoring big (and usually uncontrolled) datasets it’s important to handle errors gracefully. You don’t want to rescore 100 records because you fail on the 101st record. Rather than throwing an exception (and failing the job) we’ve added an indicator to the output tuple that can be used for alerting.
  • Although this is currently written to be run in Pig we may migrate in the future to different platforms.

Obviously, more can be done. We welcome ideas on how to make the code better.  Feel free to make a pull request!

Conclusion


We’re excited to introduce Surus and share with the world in the upcoming months various UDF’s we find helpful while analyzing data at Netflix. ScorePMML was a big win for Netflix as we sought to streamline our processing and to minimize the time to production for our models. We hope that with this function (and others soon to be released) that you’ll be able to spend more time making cool stuff and less time struggling with the mundane.

Known Issues/Limitations


  • ScorePMML is built on jPMML 1.0.19, which doesn’t fully support the 4.2 PMML specification (as defined by the Data Mining Group). At the time of this writing not all enumerated missing value strategies are supported. This caused problems when we wanted to implement GBMs in PMML, so we had to add extra nodes in each tree to properly handle missing values.
  • Hive 0.12.0 (and thus Pig) has strict naming conventions for columns/relations which are relaxed in PMML. Non alpha-numeric characters in column names are not supported in ScorePMML. Please see the Hive documentation for more details on column naming in the Hive metastore.

Additional Resources


  • The Data Mining Group PMML Spec: The 4.1.2 specification is currently supported. The 4.2 version of the PMML spec is not currently supported. The DMG page will give you a sense of which model types are supported and how they are described in PMML.
  • jPMML: A collection of GitHub projects that contain tools for using PMML. Including an alternative Pig implementation, jpmml-pig, written by Villu Ruusmann.
  • RPMML: An R-package for creating PMML files from common predictive modeling objects.

Netflix's Viewing Data: How We Know Where You Are in House of Cards

Over the past 7 years, Netflix streaming has expanded from thousands of members watching occasionally to millions of members watching over two billion hours every month.  Each time a member starts to watch a movie or TV episode, a “view” is created in our data systems and a collection of events describing that view is gathered.  Given that viewing is what members spend most of their time doing on Netflix, having a robust and scalable architecture to manage and process this data is critical to the success of our business.  In this post we’ll describe what works and what breaks in an architecture that processes billions of viewing-related events per day.

Use Cases

By focusing on the minimum viable set of use cases, rather than building a generic all-encompassing solution, we have been able to build a simple architecture that scales.  Netflix’s viewing data architecture is designed for a variety of use cases, ranging from user experiences to data analytics.  The following are three key use cases, all of which affect the user experience:

What titles have I watched?

Our system needs to know each member’s entire viewing history for as long as they are subscribed.  This data feeds the recommendation algorithms so that a member can find a title for whatever mood they’re in.  It also feeds the “recent titles you’ve watched” row in the UI.  What gets watched provides key metrics for the business to measure member engagement and make informed product and content decisions.

Where did I leave off in a given title?

For each movie or TV episode that a member views, Netflix records how much was watched and where the viewer left off.   This enables members to continue watching any movie or TV show on the same or another device.

What else is being watched on my account right now?

Sharing an account with other family members usually means everyone gets to enjoy what they like when they’d like.  It also means a member may have to have that hard conversation about who has to stop watching if they’ve hit their account’s concurrent screens limit.  To support this use case, Netflix’s viewing data system gathers periodic signals throughout each view to determine whether a member is or isn’t still watching.

Current Architecture

Our current architecture evolved from an earlier monolithic database-backed application (see this QCon talk or slideshare for the detailed history).  When it was designed, the primary requirements were that it must serve the member-facing use cases with low latency and it should be able to handle a rapidly expanding set of data coming from millions of Netflix streaming devices.  Through incremental improvements over 3+ years, we’ve been able to scale this to handle low billions of events per day.

Current Architecture Diagram

Image may be NSFW.
Clik here to view.
The current architecture’s primary interface is the viewing service, which is segmented into a stateful and stateless tier.  The stateful tier has the latest data for all active views stored in memory.  Data is partitioned into N stateful nodes by a simple mod N of the member’s account id.  When stateful nodes come online they go through a slot selection process to determine which data partition will belong to them.  Cassandra is the primary data store for all persistent data.  Memcached is layered on top of Cassandra as a guaranteed low latency read path for materialized, but possibly stale, views of the data.


We started with a stateful architecture design that favored consistency over availability in the face of network partitions (for background, see the CAP theorem).  At that time, we thought that accurate data was better than stale or no data.  Also, we were pioneering running Cassandra and memcached in the cloud so starting with a stateful solution allowed us to mitigate risk of failure for those components.  The biggest downside of this approach was that failure of a single stateful node would prevent 1/nth of the member base from writing to or reading from their viewing history.


After experiencing outages due to this design, we reworked parts of the system to gracefully degrade and provide limited availability when failures happened.  The stateless tier was added later as a pass-through to external data stores. This improved system availability by providing stale data as a fallback mechanism when a stateful node was unreachable.

Breaking Points

Our stateful tier uses a simple sharding technique (account id mod N) that is subject to hot spots, as Netflix viewing usage is not evenly distributed across all current members.  Our Cassandra layer is not subject to these hot spots, as it uses consistent hashing with virtual nodes to partition the data.  Additionally, when we moved from a single AWS region to running in multiple AWS regions, we had to build a custom mechanism to communicate the state between stateful tiers in different regions.  This added significant, undesirable complexity to our overall system.


We created the viewing service to encapsulate the domain of viewing data collection, processing, and providing.  As that system evolved to include more functionality and various read/write/update use cases, we identified multiple distinct components that were combined into this single unified service.  These components would be easier to develop, test, debug, deploy, and operate if they were extracted into their own services.


Memcached offers superb throughput and latency characteristics, but isn’t well suited for our use case.  To update the data in memcached, we read the latest data, append a new view entry (if none exists for that movie) or modify an existing entry (moving it to the front of the time-ordered list), and then write the updated data back to memcached.  We use an eventually consistent approach to handling multiple writers, accepting that an inconsistent write may happen but will get corrected soon after due to a short cache entry TTL and a periodic cache refresh.  For the caching layer, using a technology that natively supports first class data types and operations like append would better meet our needs.


We created the stateful tier because we wanted the benefit of memory speed for our highest volume read/write use cases.  Cassandra was in its pre-1.0 versions and wasn’t running on SSDs in AWS.  We thought we could design a simple but robust distributed stateful system exactly suited to our needs, but ended up with a complex solution that was less robust than mature open source technologies.  Rather than solve the hard distributed systems problems ourselves, we’d rather build on top of proven solutions like Cassandra, allowing us to focus our attention on solving the problems in our viewing data domain.


Next Generation Architecture

In order to scale to the next order of magnitude, we’re rethinking the fundamentals of our architecture.  The principles guiding this redesign are:
  • Availability over consistency - our primary use cases can tolerate eventually consistent data, so design from the start favoring availability rather than strong consistency in the face of failures.
  • Microservices - Components that were combined together in the stateful architecture should be separated out into services (components as services).
    • Components are defined according to their primary purpose - either collection, processing, or data providing.
    • Delegate responsibility for state management to the persistence tiers, keeping the application tiers stateless.
    • Decouple communication between components by using signals sent through an event queue.
  • Polyglot persistence - Use multiple persistence technologies to leverage the strengths of each solution.
    • Achieve flexibility + performance at the cost of increased complexity.
    • Use Cassandra for very high volume, low latency writes.  A tailored data model and tuned configuration enables low latency for medium volume reads.
    • Use Redis for very high volume, low latency reads.  Redis’ first-class data type support should support writes better than how we did read-modify-writes in memcached.


Our next generation architecture will be made up of these building blocks:

Image may be NSFW.
Clik here to view.


Re-architecting a critical system to scale to the next order of magnitude is a hard problem, requiring many months of development, testing, proving out at scale, and migrating off of the previous architecture.  Guided by these architectural principles, we’re confident that the next generation that we are building will give Netflix a strong foundation to meet the needs of our massive and growing scale, enabling us to delight our global audience.  We are in the early stages of this effort, so if you are interested in helping, we are actively hiringfor this work.   In the meantime, we’ll follow up this post with a future one focused on the new architecture.


Netflix Likes React


We are making big changes in the way we build the Netflix experience with Facebook’s React library. Today, we will share our thoughts on what makes React so compelling and how it is evolving our approach to UI development.

At the beginning of last year, Netflix UI engineers embarked on several ambitious projects to dramatically transform the user experience on our desktop and mobile platforms. Given a UI redesign of a scale similar to that undergone by TVs and game consoles, it was essential for us to re-evaluate our existing UI technology stack and to determine whether to explore new solutions. Do we have the right building blocks to create best-in-class single-page web applications? And what specific problems are we looking to solve?
Much of our existing front-end infrastructure consists of hand-rolled components optimized for the current website and iOS application. Our decision to adopt React was influenced by a number of factors, most notably: 1) startup speed, 2) runtime performance, and 3) modularity.

Startup Speed

We want to reduce the initial load time needed to provide Netflix members with a much more seamless, dynamic way to browse and watch individualized content. However, we find that the cost to deliver and render the UI past login can be significant, especially on our mobile platforms where there is a lot more variability in network conditions.

In addition to the time required to bootstrap our single-page application (i.e. download and process initial markup, scripts, stylesheets), we need to fetch data, including movie and show recommendations, to create a personalized experience. While network latency tends to be our biggest bottleneck, another major factor affecting startup performance is in the creation of DOM elements based on the parsed JSON payload containing the recommendations. Is there a way to minimize the network requests and processing time needed to render the home screen? We are looking for a hybrid solution that will allow us to deliver above-the-fold static markup on first load via server-side rendering, thereby reducing the tax incurred in the aforementioned startup operations, and at the same time enable dynamic elements in the UI through client-side scripting.

Runtime Performance

To build our most visually-rich cinematic Netflix experience to date for the website and iOS platforms, efficient UI rendering is critical. While there are fewer hardware constraints on desktops (compared to TVs and set-top boxes), expensive operations can still compromise UI responsiveness. In particular, DOM manipulations that result in reflows and repaints are especially detrimental to user experience.

Modularity

Our front-end infrastructure must support the numerous A/B tests we run in terms of the ability to rapidly build out new features and designs that code-wise must co-exist with the control experience (against which the new experiences are tested). For example, we can have an A/B test that compares 9 different design variations in the UI, which could mean maintaining code for 10 views for the duration of the test. Upon completion of the test, it should be easy for us to productize the experience that performed the best for our members and clean up code for the 9 other views that did not.

Advantages of React

React stood out in that its defining features not only satisfied the criteria set forth above, but offered other advantages including being relatively easy to grasp and ability to opt-out, for example, to handle custom user interactions and rendering code. We were able to leverage the following features to improve our application’s initial load times, runtime performance, and overall scalability: 1) isomorphic JavaScript, 2) virtual DOM rendering, and 3) support for compositional design patterns.

Isomorphic JavaScript

React enabled us to build JavaScript UI code that can be executed in both server (e.g. Node.js) and client contexts. To improve our start up times, we built a hybrid application where the initial markup is rendered server-side and the resulting UI elements are subsequently manipulated as done in a single-page application. It was possible to achieve this with React as it can render without a live DOM, e.g. via React.renderToString, or React.renderToStaticMarkup. Furthermore, the UI code written using the React library that is responsible for generating the markup could be shared with the client to handle cases where re-rendering was necessary.

Virtual DOM

To reduce the penalties incurred by live DOM manipulation, React applies updates to a virtual DOM in pure JavaScript and then determines the minimal set of DOM operations necessary via a diff algorithm. The diffing of virtual DOM trees is fast relative to actual DOM modifications, especially using today’s increasingly efficient JavaScript engines such as WebKit’s Nitro with JIT compilation. Furthermore, we can eliminate the need for traditional data binding, which has its own performance implications and scalability challenges.

React Components and Mixins

React provides powerful Component and Mixin APIs that we relied on heavily to create reusable views, share common functionality, and patterns to facilitate feature extension. When A/B testing different designs, we can implement the views as separate React subcomponents that get rendered by a parent component depending on the user’s allocation in the test. Similarly, differences in behavioral logic can be abstracted into React mixins. Although it is possible to achieve modularity with a classical inheritance pattern, frequent changes in superclass interfaces to support new features affects existing subclasses and increases code fragility. React’s compositional pattern is ideal for overall maintenance and scalability of our front-end codebase as it isolates much of the A/B test code.

React has exceeded our requirements and enabled us to build a tremendous foundation on which to innovate the Netflix experience. Stay tuned in the coming months, as we will dive more deeply into how we are using React to transform traditional UI development!

By Jordanna Kwok


SPS : the Pulse of Netflix Streaming

We want to provide an amazing experience to each member, winning the “moments of truth” where they decide what entertainment to enjoy.  To do that, we need to understand the health of our system.  To quickly and easily understand the health of the system, we need a simple metric that a diverse set of people can comprehend.  In this post we will discuss how we discovered and aligned everyone around one operational metric indicating service health, enabling us to streamline production operations and improve availability.  We will detail how we approach signal analysis, deviation detection, and alerting for that signal and for other general use cases.

Creating the Right Signal

In the early days of Netflix streaming, circa 2008, we manually tracked hundreds of metrics, relying on humans to detect problems.  Our approach worked for tens of servers and thousands of devices, but not for the thousands of servers and millions of devices that were in our future.  Complexity and human-reliant approaches don’t scale; simplicity and algorithm-driven approaches do.

We sought out a single indicator that closely approximated our most important activity: viewing.  We discovered that a server-side metric related to playback starts (the act of “clicking play”) had both a predictable pattern and fluctuated significantly when UI/device/server problems were happening.  The Netflix streaming pulse was created.  We named it “SPS” for “starts per second”.

Image may be NSFW.
Clik here to view.
Example of stream starts per second, comparing week over week (red = current week, black = prior week)

The SPS pattern is regular within each geographic region, with variations due to external influences like major regional holidays and events.  The regional SPS pattern is one cycle per day and oscillates in a rising and falling pattern.  The peaks occur in the evening and the troughs occur in the early morning hours.  On regional holidays, when people are off work and kids are home from school, we see increased viewing in the daytime hours, as our members have more free time to enjoy viewing a title on Netflix.

Because there is consistency in the streaming behaviors of our members, with a moderate amount of data we can establish reliable predictions on how many stream starts we should expect at any point of the week.  Deviations from the prediction are a powerful way to tell the entire company when there is a problem with the service.  We use these deviations to trigger alerts and help us understand when service has been fully restored.

Its simplicity allows SPS to be central to our internal vernacular.  Production problems are categorized as “SPS impacting” or “not SPS impacting,” indicating their severity.  Overall service availability is measured using expected versus actual SPS levels.

Deviation Detection Models

To maximize the power of SPS, we need reliable ways to find deviations in our actual stream starts relative to our expected stream starts. The following are a range of techniques that we have explored in detecting such deviations.

Static Thresholds

A common starting place when trying to detect change is to define a fixed boundary that characterizes normal behavior. This boundary can be described as a floor or ceiling which, if crossed, indicates a deviation from normal behavior. The simplicity of static thresholds makes them a popular choice when trying to detect a presence, or increase, in a signal. For example, detecting when there is an increase in CPU usage:

Image may be NSFW.
Clik here to view.
Example where a static threshold could be used to help detect high CPU usage

However, static thresholds are insufficient in accurately capturing deviations in oscillating signals. For example, a static threshold would not be suitable for accurately detecting a drop in SPS due to its oscillating nature.

Exponential Smoothing

Another technique that can be used to detect deviations is to use an exponential smoothing function, such as exponential moving average, to compute an upper or lower threshold that bounds the original signal. These techniques assign exponentially decreasing weights as the observations get older. The benefit of this approach is that the bound is no longer static and can “move” with the input signal, as shown in the image below:

Image may be NSFW.
Clik here to view.
Example of data smoothing using moving average

Another benefit is that exponential smoothing techniques take into account all past observations. In addition, exponential smoothing requires only the most recent observation to be kept. These aspects make it desirable for real-time alerting.

Double Exponential Smoothing

To detect a change in SPS behavior, we use Double Exponential Smoothing (DES) to define an upper and lower boundary that captures the range of acceptable behavior. This technique includes a parameter that takes into account any trend in the data, which works well for following the oscillating trend in SPS. There are more advanced smoothing techniques, such as triple exponential smoothing, which also take into account seasonal trends. However, we do not use these techniques as we are interested in detecting a deviation in behavior over a short period of time which does not contain a pronounced seasonal trend.

Before creating a DES model one must first select values for the data smoothing factor and the trend smoothing factor. To visualize the effect these parameters have on DES, see this interactive visualization. The estimation of these parameters is crucial as they can greatly affect accuracy. While these parameters are typically determined by an individual's intuition or trial and error, we have experimented with data-driven approaches to automatically initialize them (motivated by Gardner [1]). We are able to apply those identified parameters to signals that share similar daily patterns and trends, for example SPS at the device level.

The image below shows an example where DES has been used to create a lower bound in an attempt to capture a deviation in normal behavior. Shortly after 18:00 there is a drop in SPS which crosses the DES threshold, alerting us to a potential issue with our service. By alerting on this drop, we can respond and take actions to restore service health.

Image may be NSFW.
Clik here to view.

While DES accurately identifies a drop in SPS, it is unable to predict when the system has recovered. In the example below, the sharp recovery of SPS at approximately 20:00 is not accurately modeled by DES causing it to underpredict and generate false alarms for a short period of time:

Image may be NSFW.
Clik here to view.

In spite of these shortcomings, DES has been an effective mechanism for detecting actionable deviations in SPS and other operational signals.

Advanced Techniques

We have begun experimenting with Bayesian techniques in a stream mining setting to improve our ability to detect deviations in SPS. An example of this is Bayesian switchpoint detection and Markov Chain Monte Carlo (MCMC) [2]. See [3] for a concise introduction to using MCMC for anomaly detection and [4] for Bayesian switchpoint detection.

Bayesian techniques offer some advantages over DES in this setting. Those familiar with probabilistic programming techniques know that the underlying models can be fairly complex, but they can be made to be non-parametric by drawing parameters from uniform priors when possible. Using the posteriors from such calculations as priors for the next iteration allows us to create models that evolve as they receive more data.

Unfortunately, our experiments with Bayesian anomaly detection have revealed downsides compared to DES. MCMC is significantly more computationally intensive than DES, so much so that some are exploiting graphics cards in order to reduce the run time [5], a common technique for computationally intensive processes [6]. Furthermore the underlying model is not as easily interpreted by a human due to the complexity of the parameter interactions. These limitations, especially the performance related ones, restrict our ability to apply these techniques to a broad set of metrics in real time.

Bayesian techniques, however, do not solve the entire problem of data stream mining in a non-stationary setting. There exists a rich field of research on the subject of real-time data stream mining [7]. MCMC is by design a batch process, though it can be applied in a mini-batch fashion. Our current research is incorporating learnings from the stream-mining community in stream classification and drift detection. Additionally, our Data Science and Engineering team has been working on an approach based on Robust Principal Component Analysis (PCA) to deal with high cardinality data. We’re excited to see what comes from this research in 2015.

Conclusion

We have streamlined production operations and improved availability by creating a single directional metric that indicates service health: SPS. We have experimented with and used a number of techniques to derive additional insight from this metric including threshold-based alerting, exponential and double exponential smoothing, and bayesian and stream mining approaches. SPS is the pulse of Netflix streaming, focusing the minds at Netflix on ensuring streaming is working when you want it to be.

If you would like to join us in tackling these kinds of challenges, we are hiring!


References


Nicobar: Dynamic Scripting Library for Java

By James Kojo, Vasanth Asokan, George Campbell, Aaron Tull


The Netflix API is the front door to the streaming service, handling billions of requests per day from more than 1000 different device types around the world. To provide the best experience to our subscribers, it is critical that our UI teams have the ability to innovate at a rapid pace. As described in our blog post a year ago, we developed a Dynamic Scripting Platform that enables this rapid innovation.

Today, we are happy to announce Nicobar, the open source script execution library that allows our UI teams to inject UI-specific adapter code dynamically into our JVM without the API team’s involvement. Named after a remote archipelago in the eastern Indian Ocean, Nicobar allows each UI team to have its own island of code to optimize the client/server interaction for each device, evolved at its own pace.

Background

As of this post’s writing, a single Netflix API instance hosts hundreds of UI scripts, developed by a dozen teams. Together, they deploy anywhere between a handful to a hundred UI scripts per day. A strong, core scripting library is what allows the API JVM to handle this rate of deployment reliably and efficiently.

Our success with the scripting approach in the API platform led us to identify other applications that could benefit also from the ability to alter their behavior without a full scale deployment. Nicobar is a library that provides this functionality in a compact and reusable manner, with pluggable support for JVM languages.

Architecture Overview

Early implementations of dynamic scripting at Netflix used basic java classloader technology to host and sandbox scripts from one another. While this was a good start, it was not nearly enough. Standard Java classloaders can have only one parent, and thus allow only simple, flattened hierarchies. If one wants to share classloaders, this is a big limitation and an inefficient use of memory. Also, code loaded within standard classloaders is fully visible to downstream classloaders. Finer-grained visibility controls are helpful in restricting what packages are exported and imported into classloaders.

Given these experiences, we designed into Nicobar a script module loader that holds a graph of inter-dependent script modules. Under the hood, we use JBoss Modules (which is open source) to create java modules. JBoss modules represent powerful extensions to basic Java classloaders, allowing for arbitrarily complex classloader dependency graphs, including multiple parents. They also support sophisticated package filters that can be applied to incoming and outgoing dependency edges.

A script module provides an interface to retrieve the list of java classes held inside it. These classes can be instantiated and methods exercised on the instances, thereby “executing” the script module.

Script source and resource bundles are represented by script archives. Metadata for the archives is defined in the form of a script module specification, where script authors can describe the content language, inter-module dependencies, import and export filters for packages, as well as user specific metadata.

Script archive contents can be in source form and/or in precompiled form (.class files). At runtime, script archives are converted into script modules by running the archive through compilers and loaders that translate any source found into classes, and then loading up all classes into a module. Script compilers and loaders are pluggable, and out of the box, Nicobar comes with compilation support for Groovy 2, as well as a simple loader for compiled java classes.

Archives can be stored into and queried from archive repositories on demand, or via a continuous repository poller. Out of the box, Nicobar comes with a choice of file-system based or Cassandra based archive repositories. 

As the usage of a scripting system grows in scale, there is often the need for an administrative interface that supports publishing and modifying script archives, as well as viewing published archives. Towards this end, Nicobar comes with a manager and explorer subproject, based on Karyon and Pytheas.

Putting it all together

The diagram below illustrates how all the pieces work together.


Usage Example - Hello Nicobar!

Here is an example of initializing the Nicobar script module loader to support Groovy scripts.

Create a script archive

Create a simple groovy script archive, with the following groovy file:

Add a module specification file moduleSpec.json, along with the source:

Jar the source and module specification together as a jar file. This is your script archive.


Create a script module loader

Create an archive repository

If you have more than a handful of scripts, you will likely need a repository representing the collection. Let’s create a JarArchiveRepository, which is a repository of script archive jars at some file system path. Copy helloworld.jar into /tmp/archiveRepo to match the code below.

Hooking up the repository poller provides dynamic updates of discovered modules into the script module loader. You can wire up multiple repositories to a poller, which would poll them iteratively.

Execute script
Script modules can be retrieved out of the module loader by name (and an optional version). Classes can be retrieved from script modules by name, or by type. Nicobar itself is agnostic to the type of the classes held in the module, and leaves it to the application’s business logic to decide what to extract out and how to execute classes.

Here is an example of extracting a class implementing Callable and executing it:

At this point, any changes to the script archive jar will result in an update of the script module inside the module loader and new classes reflecting the update will be vended seamlessly!

More about the Module Loader

In addition to the ability to dynamically inject code, Nicobar’s module loading system also allows for multiple variants of a script module to coexist, providing for runtime selection of a variant. As an example, tracing code execution involves adding instrumentation code, which adds overhead. Using Nicobar, the application could vend classes from an instrumented version of the module when tracing is needed, while vending classes from the uninstrumented, faster version of the module otherwise. This paves the way for on demand tracing of code without having to add constant overhead on all executions. 

Module variants can also be leveraged to perform slow rollouts of script modules. When a module deployment is desired, a portion of the control flow can be directed through the new version of the module at runtime. Once confidence is gained in the new version, the update can be “completed”, by flushing out the old version and sending all control flow through the new module.

Static parts of an application may benefit from a modular classloading architecture as well. Large applications, loaded into a monolithic classloader can become unwieldy over time, due to an accumulation of unintended dependencies and tight coupling between various parts of the application. In contrast, loading components using Nicobar modules allows for well defined boundaries and fine-grained isolation between them. This, in turn, facilitates decoupling of components, thereby allowing them to evolve independently

Conclusion

We are excited by the possibilities around creating dynamic applications using Nicobar. As usage of the library grows, we expect to see various feature requests around access controls, additional persistence and query layers, and support for other JVM languages.

Project Jigsaw, the JDK’s native module loading system, is on the horizon too, and we are interested in seeing how Nicobar can leverage native module support from Jigsaw.

If these kinds of opportunities and challenges interest you, we are hiring and would love to hear from you!

What's trending on Netflix?


Every day, millions of members across the globe, from thousands of devices, visit Netflix and generate millions of viewing hours. The majority of these viewing hours are generated through the videos that are recommended by our recommender systems. We continue to invest in improving our recommender systems that aid our members to discover and watch the specific content they love. We are constantly trying to improve the quality of the recommendations using the sound foundation of AB testing.


On that front, we recently AB tested introducing a new row of videos on the home screen called “Trending Now”, which shows the videos that are trending in Netflix infused with some personalization for our members. This post explains how we built the backend infrastructure that powers the Trending Now row.


Traditionally, we pre-compute many of the recommendations for our members based on a combination of explicit signals (viewing history, ratings, My List, etc.) and other implicit signals (scroll activity, navigation, etc.) within Netflix, in near-line fashion. However, the Trending Now row is computed as events happen in real time. This allows us to not only personalize this row based on the context like time of day and day of week, but also react to sudden changes in collective interests of members, due to a real-world events such as Oscars or Halloween.


Data Collection


There are primarily two data streams that are used to determine the trending videos:
  • Play events: Videos that are played by our member
  • Impression events: Videos seen by our members in their view port

Netflix embraces Service Oriented Architecture (SOA) composed of many small fine grained services that do one thing and one thing well. In that vein, Viewing History Service captures all the videos that are played by our members. Beacon is another service that captures all impression events and user activities within Netflix. The requirement of computing recommendations in real time, presents us with an exciting challenge to make our data collection/processing pipeline a low latency, highly scalable and resilient system. We chose Kafka, a distributed messaging system, for our data pipeline as it has proven to handle millions of events per second. All the data collected by the Viewing History and Beacon services are sent to Kafka.
Data Processing


We built a custom stream processor that consumes the play and impressions events from Kafka and computes the following aggregated data:
  • Play popularity: How many times is a video played
  • Take rate: Fraction of play events over impression events for a given video

The first step in the data processing layer is to join the play and impression streams. We join them by request id, which is a unique identifier used to tie the front end calls to the backend service calls. With this join, all the plays and impressions events are grouped together for a given request id as illustrated in the figure below.


This joined stream is then partitioned by video id, for all the plays and impression events of a given video to be processed at the same consumer instance. This way, each consumer will be able to atomically calculate the total number of plays and impressions data for every video. The aggregated play popularity and take rate data are persisted into Cassandra, as shown in the figure below.


Real Time Data Monitoring


Given the importance of the data quality to the recommendation system and the user experience, we continuously do canary analysis for the event streams. This involves simple validations such as the presence of mandatory attributes within an event to more complex validations such as finding the absence of an event within a time window. With appropriate alerting in place, within minutes of every UI push, we are able to catch any data regressions with this real time stream monitoring.


It is imperative that the Kafka consumers are able to keep up with the incoming load into Kafka. Processing an event that was minutes old will neither provide a real trending effect nor help find data regression issues soon.


Bringing it all together


On a live user request, the aggregated play popularity and take rate data along with other explicit signals such as members’ viewing history and past ratings are used to compute a personalized Trending now row. The following figure shows the end to end infrastructure for building Trending Now row.


Netflix has a data-driven culture that is key to our success.  With billions of member viewing events and tens of millions of categorical preferences, we have endless opportunities to improve our recommendations even further.


We are in the midst of replacing our custom stream processor with Spark Streaming. Stay tuned for an upcoming tech blog on our resiliency testing on Spark Streaming.

If you would like to join us in tackling these kinds of challenges, we arehiring!

A Microscope on Microservices

by Coburn Watson, Scott Emmons, and Brendan Gregg


At Netflix we pioneer new cloud architectures and technologies to operate at massive scale - a scale which breaks most monitoring and analysis tools. The challenge is not just handling a massive instance count but to also provide quick, actionable insight for a large-scale, microservice-based architecture. Out of necessity we've developed our own tools for performance and reliability analysis, which we've also been open-sourcing (e.g., Atlas for cloud-wide monitoring). In this post we’ll discuss tools that the Cloud Performance and Reliability team have been developing, which are used together like a microscope switching between different magnifications as needed.

Request Flow (10X Magnification)

We'll start at a wide scale, visualizing the relationship between microservices to see which are called and how much time is spent in each:
Using an in-house dapper-like framework, we are able to layer the request demand through the aggregate infrastructure onto a simple visualization. This internal utility, Slalom, allows a given service to understand upstream and downstream dependencies, their contribution on service demand, and the general health of said requests. Data is initially represented through d3-based Sankey diagrams, with a detailed breakdown on absolute service demand and response status codes.
This high-level overview gives a general picture of all the distributed services that are composed to satisfy a request. The height of each service node shows the amount of demand on that service, with the outgoing links showing demand on a downstream service relative to its siblings.

Double-clicking a single service exposes the bi-directional demand over the time window:

The macro visualization afforded by Slalom is limited based on the data available in the underlying metrics that are sampled. To bring into focus additional metric dimensions beyond simple IPC interactions we built another tool, Mogul.

Show me my bottleneck! (100X)

The ability to decompose where time is spent both within and across the fleet of microservices can be a challenge given the number of dependencies.  Such information can be leveraged to identify the root cause of performance degradation or identify areas ripe for optimization within a given microservice.  Our Mogul utility consumes data from Netflix’s recently open-sourced Atlas monitoring framework, applies correlation between metrics, and selects those most likely to be responsible for changes in demand on a given microservice. The different resources evaluated include:
  • System resource demand (CPU, network, disk)
  • JVM pressure (thread contention, garbage collection)
  • Service IPC calls
  • Persistency-related calls (EVCache, Cassandra)
  • Errors and timeouts
It is not uncommon for a mogul query to pull thousands of metrics, subsequently reducing to tens of metrics through correlation with system demand. In the following example, we were able to quickly identify which downstream service was causing performance issues for the service under study. This particular microservice has over 40,000 metrics. Mogul reduced this internally to just over 2000 metrics via pattern matching, then correlated the top 4-6 interesting metrics grouped into classifications.

The following diagram displays a perturbation in the microservice response time (blue line) as it moves from ~125 to over 300 milliseconds.  The underlying graphs identifies those downstream calls that have a time-correlated increase in system demand.


Like Slalom, Mogul uses Little’s Law - the product of response time and throughput - to compute service demand.

My instance is bad ... or is it? (1000X)

Those running on the cloud or virtualized environments are not unfamiliar with the phrase “my instance is bad.” To evaluate if a given host is unstable or under pressure it is important to have the right metrics available on-demand and at a high resolution (5 seconds or less).  Enter Vector, our on-instance performance monitoring framework which exposes hand-picked, high-resolution system metrics to every engineer’s browser.  Leveraging the battle tested system monitoring framework Performance Co-Pilot (pcp) we are able to layer on a UI that polls instance-level metrics between every 1 and 5 seconds.  


This resolution of system data exposes possible multi-modal performance behavior not visible with higher-level aggregations.  Many times a runaway thread has been identified as a root cause of performance issues while overall CPU utilization remains low.  Vector abstracts away the complexity typically required with logging onto a system and running a large number of commands from the shell.

A key feature of Vector and pcp is extensibility.  We have created multiple custom pcp agents to expose additional key performance views.  One example is a flamegraph generated by sampling the on-host Java process using jstack.  This view allows an engineer to quickly drill on where the Java process is spending CPU time.

Next Steps..To Infinity and Beyond

The above tools have proved invaluable in the domain of performance and reliability analysis at Netflix, and  we are looking to open source Vector in the coming months. In the meantime we continue to extend our toolset by improving instrumentation capabilities at a base level. One example is a patch on OpenJDK which allows the generation of extended stack trace data that can be used to visualize system-through-user space time in the process stack.

Conclusion

It quickly became apparent at Netflix’s scale that viewing the performance of the aggregate system through a single lens would be insufficient.  Many commercial tools promise a one-stop shop but have rarely scaled to meet our needs.  Working from a macro-to-micro view, our team developed tools based upon the use cases we most frequently analyze and triage.  The result is much like a microscope which lets engineering teams select the focal length that most directly targets their dimension of interest.

As one engineer on our team puts it, “Most current performance tool methodologies are so 1990’s.” Finding and dealing with future observability challenges is key to our charter, and we have the team and drive to accomplish it.  If you would like to join us in tackling this kind of work, we are hiring!

Netflix Releases Falcor Developer Preview

by Jafar Husain, Paul Taylor and Michael Paulson

Developers strive to create the illusion that all of their application’s data is sitting right there on the user’s device just waiting to be displayed. To make that experience a reality, data must be efficiently retrieved from the network and intelligently cached on the client.

That’s why Netflix created Falcor, a JavaScript library for efficient data fetching. Falcor powers Netflix’s mobile, desktop and TV applications.

Falcor lets you represent all your remote data sources as a single domain model via JSON Graph. Falcor makes it easy to access as much or as little of your model as you want, when you want it. You retrieve your data using familiar JavaScript operations like get, set, and call. If you know your data, you know your API.

You code the same way no matter where the data is, whether in memory on the client or over the network on the server. Falcor keeps your data in a single, coherent cache and manages stale data and cache pruning for you. Falcor automatically traverses references in your graph and makes requests as needed. It transparently handles all network communications, opportunistically batching and de-duping requests.

Today, Netflix is unveiling a developer preview of Falcor:

Falcor is still under active development and we’ll be unveiling a roadmap soon. This developer preview includes a Node version of our Falcor Router not yet in production use.

We’re excited to start developing in the open and share this library with the community, and eager for your feedback and contributions.

For ongoing updates, follow Falcor on Twitter!

Fenzo: OSS Scheduler for Apache Mesos Frameworks

Bringing Netflix to our millions of subscribers is no easy task. The product comprises dozens of services in our distributed environment, each of which is operating a critical component to the experience while constantly evolving with new functionality. Optimizing the launch of these services is essential for both the stability of the customer experience as well as overall performance and costs. To that end, we are happy to introduce Fenzo, an open source scheduler for Apache Mesos frameworks. Fenzo tightly manages the scheduling and resource assignments of these deployments.


Fenzo is now available in the Netflix OSS suite. Read on for more details about how Fenzo works and why we built it. For the impatient, you can find source code and docs on Github.

Why Fenzo?

Two main motivations for developing a new framework, as opposed to leveraging one of the many frameworks in the community, were to achieve scheduling optimizations and to be able to autoscale the cluster based on usage, both of which will be discussed in greater detail below. Fenzo enables frameworks to better manage ephemerality aspects that are unique to the cloud. Our use cases include a reactive stream processing system for real time operational insights and managing deployments of container based applications.


At Netflix, we see a large variation in the amount of data that our jobs process over the course of a day. Provisioning the cluster for peak usage, as is typical in data center environments, is wasteful. Also, systems may occasionally be inundated with interactive jobs from users responding to certain anomalous operational events. We need to take advantage of the cloud’s elasticity and scale the cluster up and down based on dynamic loads.


Although scaling up a cluster may seem relatively easy by watching, for example, the amount of available resources falling below a threshold, scaling down presents additional challenges. If the tasks are long lived and cannot be terminated without negative consequences, such as time consuming reconfiguration of stateful stream processing topologies, the scheduler will have to assign them such that all tasks on a host terminate at about the same time so the host can be terminated for scale down.

Scheduling Strategy

Scheduling tasks requires optimization of resource assignments to maximize the intended goals. When there are multiple resource assignments possible, picking one versus another can lead to significantly different outcomes in terms of scalability, performance, etc. As such, efficient assignment selection is a crucial aspect of a scheduler library. For example, picking assignments by evaluating every pending task with every available resource is computationally prohibitive.

Scheduling Model

Our design focused on large scale deployments with a heterogeneous mix of tasks and resources that have multiple constraints and optimizations needs. If evaluating the most optimal assignments takes a long time, it could create two problems:
  • resources become idle, waiting for new assignments
  • task launches experience increased latency


Fenzo adopts an approach that moves us quickly in the right direction as opposed to coming up with the most optimal set of scheduling assignments every time.


Conceptually, we think of tasks as having an urgency factor that determines how soon it needs an assignment, and a fitness factor that determines how well it fits on a given host.
If the task is very urgent or if it fits very well on a given resource, we go ahead and assign that resource to the task. Otherwise, we keep the task pending until either urgency increases or we find another host with a larger fitness value.

Trading Off Scheduling Speed with Optimizations

Fenzo has knobs for you to choose speed and optimal assignments dynamically. Fenzo employs a strategy of evaluating optimal assignments across multiple hosts, but, only until a fitness value deemed “good enough” is obtained. While a user defined threshold for fitness being good enough controls the speed, a fitness evaluation plugin represents the optimality of assignments and the high level scheduling objectives for the cluster. A fitness calculator can be composed from multiple other fitness calculators, representing a multi-faceted objective.

Task Constraints

Fenzo tasks can use optional soft or hard constraints to influence assignments to achieve locality with other tasks and/or affinity to resources. Soft constraints are satisfied on a best efforts basis and combine with the fitness calculator for scoring hosts for possible assignment. Hard constraints must be satisfied and act as a resource selection filter.

Fenzo provides all relevant cluster state information to the fitness calculators and constraints plugins so you can optimize assignments based on various aspects of jobs, resources, and time.

Bin Packing and Constraints Plugins

Fenzo currently has built-in fitness calculators for bin packing based on CPU, memory, or network bandwidth resources, or a combination of them.


Some of the built-in constraints address common use cases of locality with respect to resource types, assigning distinct hosts to a set of tasks, balancing tasks across a given host attribute, such as the availability zone, rack location, etc.


You can customize fitness calculators and constraints by providing new plugins.

Cluster Autoscaling

Fenzo supports cluster autoscaling using two complementary strategies:
  • Thresholds based
  • Resource shortfall analysis based


Thresholds based autoscaling lets users specify rules per host group (e.g., EC2 Auto Scaling Group, ASG) being used in the cluster. For example, there may be one ASG created for compute intensive workloads using one EC2 instance type, and another for network intensive workloads. Each rule helps maintain a configured number of idle hosts available for launching new jobs quickly.


The resource shortfall analysis attempts to estimate the number of hosts required to satisfy the pending workload. This complements the rules based scale up during demand surges. Fenzo’s autoscaling also complements predictive autoscaling systems, such as Netflix’s Scryer.

Usage at Netflix

Fenzo is currently being used in two Mesos frameworks at Netflix for a variety of use cases including long running services and batch jobs. We have observed that the scheduler is fast at allocating resources with multiple constraints and custom fitness calculators. Also, Fenzo has allowed us to scale the cluster based on current demand instead of provisioning it for peak demand.


The table below shows the average and maximum times we have observed for each scheduling run in one of our clusters. Each scheduling run may attempt to assign resources to more than one task. The run time can vary depending on the number of tasks that need assignments, the number and types of constraints used by the tasks, and the number of hosts to choose resources from.


Scheduler run time in milliseconds
Average
2 mS
Maximum
38 mS
(occasional spikes of about 30 mS)


The image below shows the number of Mesos slaves in the cluster going up and down as a result of Fenzo’s autoscaler actions over several days, representing about 3X difference in the maximum and minimum counts.
Image may be NSFW.
Clik here to view.
TitanAutoscaling2.png
.

Fenzo Usage in Mesos Frameworks

Image may be NSFW.
Clik here to view.
FenzoUsageDiagram.png
A simplified diagram above shows how Fenzo is used by an Apache Mesos framework. Fenzo’s task scheduler provides the scheduling core without interaction with Mesos itself. The framework, interfaces with Mesos to get callbacks on new resource offers and task status updates. As well, it calls Mesos driver to launch tasks based on Fenzo’s assignments.

Summary

Fenzo has been a great addition to our cloud platform. It gives us a high degree of control over work scheduling on Mesos, and has enabled us to strike a balance between machine efficiency and getting jobs running quickly. Out of the box Fenzo supports cluster autoscaling and bin packing. Custom schedulers can be implemented by writing your own plugins.


Source code is available on Netflix Github. The repository contains a sample framework that shows how to use Fenzo. Also, the JUnit tests show examples of various features including writing custom fitness calculators and constraints. Fenzo wiki contains detailed documentation on getting you started.

From Chaos to Control - Testing the resiliency of Netflix’s Content Discovery Platform

By:Leena Janardanan, Bruce Wobbe, Vilas Veeraraghavan

Introduction
Merchandising Application Platform (MAP) was conceived as a middle-tier service that would handle real time requests for content discovery. MAP does this by aggregating data from disparate data sources and implementing common business logic into one distinct layer. This centralized layer helps provide common experiences across device platforms and helps reduce duplicate, and sometimes, inconsistent business logic. In addition, it also allows recommendation systems - which are typically pre-compute systems - to be de-coupled from the real time path. MAP can be compared to a big funnel through which most of the content discovery data on a user’s screen goes through and is processed.
As an example, MAP generates localized row names for the personalized recommendations on the home page. This happens in real time, based on the locale of the user at the time the request is made. Similarly, application of maturity filters, localizing and sorting categories are examples of logic that lives in MAP.


Image may be NSFW.
Clik here to view.
Localized categories and row names, up-to-date My List and Continue Watching


A classic example of duplicated but inconsistent business logic that MAP consolidated was the “next episode” logic -  the rule to determine if a particular episode was completed and the next episode should be shown. In one platform, it required that credits had started and/or 95% of the episode to be finished. In another platform, it was simply that 90% of the episode had to be finished. MAP consolidated this logic into one simple call that all devices now use.
 MAP also enables discovery data to be a mix of pre-computed and real time data. On the homepage, rows like My List, Continue Watching and Trending Now are examples of real time data whereas rows like “Because you watched” are pre-computed. As an example, if a user added a title to My List on a mobile device and decided to watch the title on a Smart TV, the user would expect My List on the TV to be up-to-date immediately. What this requires is the ability to selectively update some data in real time. MAP provides the APIs and logic to detect if data has changed and update it as needed. This allows us to keep the efficiencies gained from pre-compute systems for most of the data, while also having the flexibility to keep other data fresh.
MAP also supports business logic required for various A/B tests, many of which are active on Netflix at any given time. Examples include: inserting non-personalized  rows, changing the sort order for titles within a row and changing the contents of a row.
The services that generate this data are a mix of pre-compute and real time systems. Depending on the data, the calling patterns from devices for each type of data also vary. Some data is fetched once per session, some of it is pre-fetched when the user navigates the page/screen and other data is refreshed constantly (My List, Recently Watched, Trending Now).

Architecture

MAP is comprised of two parts - a server and a client. The server is the workhorse which does all the data aggregation and applies business logic. This data is then stored in caches (see EVCache) the client reads. The client primarily serves the data and is the home for resiliency logic. The client decides when a call to the server is taking too long, when to open a circuit (see Hystrix) and, if needed, what type of fallback should be served.


Image may be NSFW.
Clik here to view.


MAP is in the critical path of content discovery. Without a well thought out resiliency story, any failures in MAP would severely impact the user experience and Netflix's availability. As a result, we spend a lot of time thinking about how to make MAP resilient.

Challenges in making MAP resilient
Two approaches commonly used by MAP to improve resiliency are:
(1) Implementing fallback responses for failure scenarios
(2) Load shedding - either by opening circuits to the downstream services or by limiting retries wherever possible.

There are a number of factors that make it challenging to make MAP resilient: 
(1) MAP has numerous dependencies, which translates to multiple points of failure. In addition, the behavior of these dependencies evolves over time, especially as A/B tests are launched, and a solution that works today may not do so in 6 months. At some level, this is a game of Whack-A-Mole as we try to keep up with a constantly changing eco system.

(2) There is no one type of fallback that works for all scenarios:
    • In some cases, an empty response is the only option and devices have to be able to handle that gracefully. E.g. data for the "My List" row couldn't be retrieved.
    • Various degraded modes of performance can be supported. E.g. if the latest personalized home page cannot be delivered, fallbacks can range from stale, personalized recommendations to non-personalized recommendations.
    • In other cases, an exception/error code might be the right response, indicating to clients there is a problem and giving them the ability to adapt the user experience - skip a step in a workflow, request different data, etc.

How do we go from Chaos to Control?

Early on, failures in MAP or its dependent services caused SPS dips like this:
Image may be NSFW.
Clik here to view.


It was clear that we needed to make MAP more resilient. The first question to answer was - what does resiliency mean for MAP? It came down to these expectations:
(1) Ensure an acceptable user experience during a MAP failure, e.g. that the user can browse our selection and continue to play videos
(2) Services that depend on MAP i.e. the API service and device platforms are not impacted by a MAP failure and continue to provide uninterrupted services
(3) Services that MAP depends on are not overwhelmed by excessive load from MAP

It is easy enough to identify obvious points of failure. For example - if a service provides data X, we could ensure that MAP has a fallback for data X being unavailable. What is harder is knowing the impact of failures in multiple services - different combinations of them - and the impact of higher latencies.

This is where the Latency Monkey and FIT come in. Running Latency Monkey in our production environment allows us to detect problems caused by latent services. With Latency Monkey testing, we have been able to fix incorrect behaviors and fine tune various parameters on the backend services like:
(1) Timeouts for various calls
(2) Thresholds for opening circuits via Hystrix
(3) Fallbacks for certain use cases
(4) Thread pool settings

FIT, on the other hand, allows us to simulate specific failures. We restrict the scope of failures to a few test accounts. This allows us to validate fallbacks as well as the user experience. Using FIT, we are able to sever connections with:
(1) Cache that handles MAP reads and writes 
(2) Dependencies that MAP interfaces with
(3) MAP service itself


Image may be NSFW.
Clik here to view.


What does control look like?


In a successful run of FIT or Chaos Monkey, this is how metrics look like now:
Image may be NSFW.
Clik here to view.
Total requests served by MAP before and during the test(no impact)

Image may be NSFW.
Clik here to view.
MAP successful fallbacks during the test(high fallback rate)


On a lighter note, our failure simulations uncovered some interesting user experience issues, which have since been fixed.

  1. Simulating failures in all the dependent services of MAP server caused an odd data mismatch to happen:
Image may be NSFW.
Clik here to view.
The Avengers shows graphic for Peaky Blinders


  1. Severing connections to MAP server and the cache caused these duplicate titles to be served:
Image may be NSFW.
Clik here to view.


  1. When the cache was made unavailable mid session, some rows looked like this:
Image may be NSFW.
Clik here to view.


  1. Simulating a failure in the “My List” service caused the PS4 UI to be stuck on adding a title to My List:
Image may be NSFW.
Clik here to view.


In an ever evolving ecosystem of many dependent services, the future of resiliency testing resides in automation. We have taken small but significant steps this year towards making some of these FIT tests automated. The goal is to build these tests out so they run during every release and catch any regressions.


Looking ahead for MAP, there are many more problems to solve. How can we make MAP more performant? Will our caching strategy scale to the next X million customers? How do we enable faster innovation without impacting reliability? Stay tuned for updates!


Announcing Sleepy Puppy - Cross-Site Scripting Payload Management for Web Application Security Testing

by: Scott Behrens and Patrick Kelley

Netflix is pleased to announce the open source release of our cross-site scripting (XSS) payload management framework: Sleepy Puppy!
Image may be NSFW.
Clik here to view.

The Challenge of Cross-Site Scripting

Cross-site scripting is a type of web application security vulnerability that allows an attacker to execute arbitrary client-side script in a victim’s browser. XSS has been listed on the OWASP Top 10 vulnerability list since 2004, and developers continue to struggle with mitigating controls to prevent XSS (e.g. content security policy, input validation, output encoding). According to a recent report from WhiteHat Security, a web application is 47% likely to have one or more cross-site scripting vulnerabilities. 

A number of tools are available to identify cross-site scripting issues; however, security engineers are still challenged to fully cover the scope of applications in their portfolio. Automated scans and other security controls provide a base level of coverage, but often only focus on the target application. 


Delayed XSS Testing

Delayed XSS testing is a variant of stored XSS testing that can be used to extend the scope of coverage beyond the immediate application being tested. With delayed XSS testing, security engineers inject an XSS payload on one application that may get reflected back in a separate application with a different origin. Let’s examine the following diagram.
Image may be NSFW.
Clik here to view.


Here we see a security engineer inject an XSS payload into the assessment target (App #1 Server) that does not result in an XSS vulnerability. However, that payload was stored in a database (DB) and reflected back in a second application not accessible to the tester. Even though the tester can’t access the vulnerable application, the vulnerability could still be used to take advantage of the user. In fact, these types of vulnerabilities can be even more dangerous than standard XSS since the potential victims are likely to be privileged types of users (employees, administrators, etc.) 

To discover the triggering of a delayed XSS attack, the payload must alert the tester of App #2’s vulnerability in a different manner. 


Toward Better Delayed XSS Payload Management

A number of talks and tools cover XSS testing, with some focussing on the delayed variant. Tools like BEef, PortSwigger BurpSuite Collaborator, and XSS.IO are appropriate for a number of situations and can be beneficial tools in the application security engineer’s portfolio. However, we wanted a more comprehensive XSS testing framework to simplify XSS propagation and identification and allow us to work with developers to remediate issues faster. 

Without further ado, meet Sleepy Puppy! 


Sleepy Puppy

Sleepy Puppy is a XSS payload management framework that enables security engineers to simplify the process of capturing, managing, and tracking XSS propagation over long periods of time and numerous assessments.

We will use the following terminology throughout the rest of the discussion:

  • Assessments describe specific testing sessions and allow the user to optionally receive email notifications when XSS issues are identified for those assessments.
  • Payloads are XSS strings to be executed and can include the full range of XSS injection.
  • PuppyScripts are typically written in JavaScript and provide a way to collect information on where the payload executed. 
  • Captures are the screenshots and metadata collected by the default PuppyScript
  • Generic Collector is an endpoint that allows you to optionally log additional data outside the scope of a traditional capture. 

Sleepy Puppy is highly configurable, and you can create your own payloads and PuppyScripts as needed.

Security engineers can leverage the Sleepy Puppy assessment model to categorize payloads and subscribe to email notifications when delayed cross-site scripting events are triggered.

Sleepy Puppy also exposes an API for users who may want to develop plugins for scanners such as Burp or Zap. With Sleepy Puppy, our workflow of testing now looks like this:
Image may be NSFW.
Clik here to view.


Testing is straightforward as Sleepy Puppy ships with a number of payloads, PuppyScripts, and an assessment. To provide a better sense of how Sleepy Puppy works in action, let’s take a look at an assessment we created for the XSS Challenge web application, a sample application that allows users to practice XSS testing.

Image may be NSFW.
Clik here to view.


To test the XSS Challenge web app, we created an assessment named 'XSS Game', which is highlighted above. When you click and highlight an assessment, you can see a number of payloads associated with this assessment. These payloads were automatically configured to have unique identifiers to help you correlate which payloads within your assessment have executed. Throughout the course of testing, counts of captures, collections, and access log requests are provided to quickly identify which payloads are executing. 

Simply copy any payload and inject it in the web application you are testing. Injecting Sleepy Puppy payloads in stored objects that may be reflected in other applications is highly recommended. 

The default PuppyScript configured for payloads captures useful metadata including the URL, DOM with payload highlighting, user-agent, cookies, referer header, and a screenshot of the application where the payload executed. This provides the tester ample knowledge to identify the impacted application so they may mitigate the vulnerability quickly. As payloads propagate throughout a network, the tester can trace what applications the payload has executed in. For more advanced use cases, security engineers can chain PuppyScripts together and even leverage the generic collector model to capture arbitrary data from any input source. 

After the payload executes, the tester will receive an email notification (if configured) and be presented with actionable data associated with the payload execution:
Image may be NSFW.
Clik here to view.


Here, the security engineer is able to view all of the information collected in Sleepy Puppy.  The researcher is presented with when the payload fired, url, referrer, cookies, user agent, DOM, and a screenshot.  


Architecture

Sleepy Puppy makes use of the following components :

  • Python 2.7 with Flask (including a number of helper packages)
  • SQLAlchemy with configurable backend storage
  • Ace Javascript editor for editing PuppyScripts
  • Html2Canvas JavaScript for screenshot capture
  • Optional use of AWS Simple Email Service (SES) for email notifications and S3 for screenshot storage

We’re shipping Sleepy Puppy with built-in payloads, PuppyScripts and a default assessment.


Getting Started

Sleepy Puppy is available now on the Netflix Open Source siteYou can try out Sleepy Puppy using Docker. Detailed instructions on setup and configuration are available on the wiki page.


Interested in Contributing?

Feel free to reach out or submit pull requests if there’s anything else you’re looking for. We hope you’ll find Sleepy Puppy as useful as we do!


Special Thanks

Thanks to Daniel Miessler for the extensive feedback after our Bay Area OWASP talk which was discussed in his blogpost.  


Conclusion

Sleepy Puppy is helping the Netflix security team identify XSS propagation through a number of systems even when those systems aren’t assessed directly. We hope that the open source community can find new and interesting uses for Sleepy Puppy, and use it to simplify their XSS testing and improve remediation times. Sleepy puppy is available on our GitHub site now!

Introducing Lemur

by: Kevin Glisson, Jason Chan and Ben Hagen

Netflix is pleased to announce the open source release of our x.509 certificate orchestration framework : Lemur!

The Challenge of Certificate Management
Public Key Infrastructureis a set of hardware, software, people, policies, and procedures needed to create, manage, distribute, use, store, and revoke digital certificates and manage public-key encryption. PKI allows for secure communication by establishing chains of trust between two entities.


There are three main components to PKI that we are attempting to address:
  1. Image may be NSFW.
    Clik here to view.

    Public Certificate - A cryptographic document that proves the ownership of a public key, which can be used for signing, proving identity or encrypting data.
  2. Private Key - A cryptographic document that is used to decrypt data encrypted by a public key.
  3. Certificate Authorities (CAs) - Third-party or internal services that validate those they do business with. They provide confirmation that a client is talking to the server it thinks it is. Their public certificates are loaded into major operating systems and provide a basis of trust for others to build on.


The management of all the pieces needed for PKI can be a confusing and painful experience. Certificates have expiration dates - if they are allowed to expire without replacing communication can be interrupted, impacting a system’s availability. And, private keys must never be exposed to any untrusted entities - any loss of a private key can impact the confidentiality of communications. There is also increased complexity when creating certificates that support a diverse pool of browsers and devices. It is non-trivial to track which devices and browsers trust which certificate authorities.


On top of the management of these sensitive and important pieces of information, the tools used to create manage and interact with PKI have confusing or ambiguous options. This lack of usability can lead to mistakes and undermine the security of PKI.


For non-experts the experience of creating certificates can be an intimidating one.


Empowering the Developer

At Netflix developers are responsible for their entire application environment, and we are moving to an environment that requires the use of HTTPS for all web applications. This means developers often have to go through the process of certificate procurement and deployment for their services. Let’s take a look at what a typical procurement process might look like:
Here we see an example workflow that a developer might take when creating a new service that has TLS enabled.


Image may be NSFW.
Clik here to view.
There are quite a few steps to this process and much of it is typically handled by humans. Let’s enumerate them:
  1. Create Certificate Signing Request (CSR) - A CSR is a cryptographically signed request that has information such as State/Province, Location, Organization Name and other details about the entity requesting the certificate and what the certificate is for. Creating a CSR typically requires the developer to use OpenSSL commands to generate a private key and enter the correct information. The OpenSSL command line contains hundreds of options and significant flexibility. This flexibility can often intimidate developers or cause them to make mistakes that undermine the security of the certificate.


  1. Submit CSR - The developer then submits the CSR to a CA. Where to submit the CSR can be confusing. Most organizations have internal and external CAs. Internal CAs are used for inter-service or inter-node communication anywhere you have control of both sides of transmission and can thus control who to trust. External CAs are typically used when you don’t have control of both sides of a transmission. Think about your browser communicating with a banking website over HTTPS. It relies on the trust built by third parties (Symantec/Digicert, GeoTrust etc.) in order to ensure that we are talking to who we think we are. External CAs are used for the vast majority of Internet-facing websites.


  1. Approve CSR - Due to the sensitive and error-prone nature of the certificate request process, the choice is often made to inject an approval process into the workflow. In this case, a security engineer would review that a request is valid and correct before issuing the certificate.


  1. Deploy Certificate - Eventually the issued certificate needs to be placed on a server that will handle the request. It’s now up to the developer to ensure that the keys and server certificates are correctly placed and configured on the server and that the keys are kept in a safe location.


  1. Store Secrets - An optional, but important step is to ensure that secrets can be retrieved at a later date. If a server ever needs to be re-deployed these keys will be needed in order to re-use the issued certificate.


Each of these steps have the developer moving through various systems and interfaces, potentially copying and pasting sensitive key material from one system to another. This kind of information spread can lead to situations where a developer might not correctly clean up the private keys they have generated or accidently expose the information, which could put their whole service at risk. Ideally a developer would never have to handle key material at all.


Toward Better Certificate Management

Certificate management is not a new challenge, tools like EJBCA, OpenCA, and more recently Let’s Encrypt are all helping to make certificate management easier. When setting out to make certificate management better we had two main goals: First, increase the usability and convenience of procuring a certificate in such a way that would not be intimidating to users. Second, harden the procurement process by generating high strength keys and handling them with care.


Meet Lemur!


Lemur

Lemur is a certificate management framework that acts as a broker between certificate authorities and internal deployment and management tools. This allows us to build in defaults and templates for the most common use cases, reduce the need for a developer to be exposed to sensitive key material, and provides a centralized location from which to manage and monitor all aspects of the certificate lifecycle.


We will use the following terminology throughout the rest of the discussion:


  • Issuers are internal or third-party certificate authorities
  • Destinations are deployment targets, for TLS these would be the servers terminating web requests.
  • Sources are any certificate store, these can include third party sources such as AWS, GAE, even source code.
  • Notifications are ways for a subscriber to be notified about a change with their certificate.


Unlike many of our tools Lemur is not tightly bound to AWS, in fact Lemur provides several different integration points that allows it to fit into just about any existing environment.


Security engineers can leverage Lemur to act as a broker between deployment systems and certificate authorities. It provides a unified view of, and tracks all certificates in an environment regardless of where they were issued.  


Let’s take a look at what a developer's new workflow would look like using Lemur:


Some key benefits of the new workflow are:
  • Developer no longer needs to know OpenSSL commands
  • Developer no longer needs to know how to safely handle sensitive key material
  • Certificate is immediately deployed and usable
  • Keys are generated with known strength properties
  • Centralized tracking and notification
  • Common API for internal users


Image may be NSFW.
Clik here to view.
This interface is much more forgiving than that of a command line and allows for helpful suggestions and input validation.
Image may be NSFW.
Clik here to view.
For advanced users, Lemur supports all certificate options that the target issuer supports.


Lemur’s destination plugins allow for a developer to pick an environment to upload a certificate. Having Lemur handle the propagation of sensitive material keeps it off developer’s laptops and ensures secure transmission. Out of the box Lemur supports multi-account AWS deployments. Over time, we hope that others can use the common plugin interface to fit their specific needs.


Even with all the things that Lemur does for us we knew there would use cases where certificates are not issued through Lemur. For example, a third party hosting and maintaining a marketing site, or a payment provider generating certificates for secure communication with their service.


To help with these use cases and provide the best possible visibility into an organization’s certificate deployment, Lemur has the concept of source plugins and the ability to import certificates. Source plugins allow Lemur to reach out into different environments and discover and catalog existing certificates, making them an easy way to bootstrap Lemur’s certificate management within an organization.

Lemur creates, discovers and deploys certificates. It also securely stores the sensitive key material created during the procurement process. Letting Lemur handle key management provides a centralized and known method of encryption and the ability to audit the key’s usage and access.


Architecture

Lemur makes use of the following components :
  • Python 2.7, 3.4 with Flask API (including a number of helper packages)
  • AngularJS UI
  • Postgres
  • Optional use of AWS Simple Email Service (SES) for email notifications
We’re shipping Lemur with built-in plugins for that allow you to issue certificates from Verisign/Symantec and allow for the discovery and deployment of certificates into AWS.


Getting Started

Lemur is available now on theNetflix Open Source site. You can try out Lemur usingDocker. Detailed instructions on setup and configuration are available in our docs.


Interested in Contributing?

Feel free to reach out or submit pull requests if you have any suggestions. We’re looking forward to seeing what new plugins you create to to make Lemur your own! We hope you’ll find Lemur as useful as we do!


Conclusion

Lemur is helping the Netflix security team manage our PKI infrastructure by empowering developers and creating a paved road to SSL/TLS enabled applications. Lemur is available on ourGitHub site now!

Announcing Electric Eye

By: Michael Russell

Image may be NSFW.
Clik here to view.
Electric Eye Icon
Netflix ships on a wide variety of devices, ranging from small thumbdrive-sized HDMI dongles to ultra-massive 100”+ curved screen HDTVs, and the wide variety of form factors leads to some interesting challenges in testing. In this post, we’re going to describe the genesis and evolution of Electric Eye, an automated computer vision and audio testing framework created to help test Netflix on all of these devices.

Let’s start with the Twenty-First Century Communications and Video Accessibility Act of 2010, or CCVA for short. Netflix creates closed caption files for all of our original programming, like Marvel’s Daredevil, Orange is the New Black, and House of Cards, and we serve closed captions for any content that we have captions for. Closed captions are sent to devices as Timed Text Markup Language (TTML), and describe what the captions should say, when and where they should appear, and when they should disappear, amongst other things. The code to display captions on devices is a combination of JavaScript served by our servers and native code on the devices. This led to an interesting question: How can we make sure that captions are showing up completely and on time? We were having humans do the work, but occasionally humans make mistakes. Given that CCVA is the law of the land, we wanted a relatively error-proof way of ensuring compliance.

If we only ran on devices with HDMI-out, we might be able to use something like stb-tester to do the work. However, we run on a wide variety of television sets, not all of which have HDMI-out. Factor in curved screens and odd aspect ratios, and it was starting to seem like there may not be a way to do this reliably for every device. However, one of the first rules of software is that you shouldn’t let your quest for perfection get in the way of making an incremental step forward.

We decided that we’d build a prototype using OpenCV to try to handle flat-screen televisions first, and broke the problem up into two different subproblems: obtaining a testable frame from the television, and extracting the captions from the frame for comparison. To ensure our prototype didn’t cost a lot of money, we picked up a few cheap 1080p webcams from a local electronics store.

OpenCV has functionality built in to detect a checkerboard pattern on a flat surface and generate a perspective-correction matrix, as well as code to warp an image based on the matrix, which made frame acquisition extremely easy. It wasn’t very fast (manually creating a lookup table using the perspective-correction matrix for use with remap improves the speed significantly), but this was a proof of concept. Optimization could come later.

The second step was a bit tricky. Television screens are emissive, meaning that they emit light. This causes blurring, ghosting, and other issues when they are being recorded with a camera. In addition, we couldn’t just have the captions on a black screen since decoding video could potentially cause enough strain on a device to cause captions to be delayed or dropped. Since we wanted a true torture test, we grabbed video of running water (one of the most strenuous patterns to play back due to its unpredictable nature), reduced its brightness by 50%, and overlaid captions on top of it. We’d bake “gold truth” captions into the upper part of the screen, show the results from parsed and displayed TTML in the bottom, and look for differences.

When we tested using HDMI capture, we could apply a thresholding algorithm to the frame and get the captions out easily.
Image may be NSFW.
Clik here to view.
Images showing captured and marked up frames
The frame on the left is what we got from HDMI capture after using thresholding.  We could then mark up the original frame received and send that to testers.
When we worked with the result from the webcam, things weren’t as nice.
Image may be NSFW.
Clik here to view.
Image showing excessive glare and spotting on a trivially thresholded webcam image
Raw thresholding didn't work as well.
Glare from ceiling lights led to unique issues, and even though the content was relatively high contrast, the emissive nature of the screen caused the water to splash through the captions.

While all of the issues that we found with the prototype were a bit daunting, they were eventually solved through a combination of environmental corrections (diffuse lighting handled most of the glare issues) and traditional OpenCV image cleanup techniques, and it proved that we could use CV to help test Netflix. The prototype was eventually able to reliably detect deltas of as little as 66ms, and it showed enough promise to let us create a second prototype, but also led to us adopting some new requirements.

First, we needed to be real-time on a reasonable machine. With our unoptimized code using the UI framework in OpenCV, we were getting ~20fps on a mid-2014 MacBook Pro, but we wanted to get 30fps reliably. Second, we needed to be able to process audio to enable new types of tests. Finally, we needed to be cross-platform. OpenCV works on Windows, Mac, and Linux, but its video capture interface doesn’t expose audio data.

For prototype #2, we decided to switch over to using a creative coding framework named Cinder. Cinder is a C++ library best known for its use by advertisers, but it has OpenCV bindings available as a “CinderBlock” as well as a full audio DSP library. It works on Windows and Mac, and work is underway on a Linux fork. We also chose a new test case to prototype: A/V sync. Getting camera audio and video together using Cinder is fairly easy to do if you follow the tutorials on the Cinder site.

The content for this test already existed on Netflix: Test Patterns. These test patterns were created specifically for Netflix by Archimedia to help us test for audio and video issues. On the English 2.0 track, a 1250Hz tone starts playing 400ms before the ball hits the bottom, and once there, the sound transitions over to a 200ms-long 1000Hz tone. The highlighted areas on the circle line up with when these tones should play. This pattern repeats every six seconds.

For the test to work, we needed to be able to tell what sound was playing. Cinder provides a MonitorSpectralNode class that lets us figure out dominant tones with a little work. With that, we could grab each frame as it came in, detect when the dominant tone changed from 1250Hz to 1000Hz, display the last frame that we got from the camera, and *poof* a simple A/V sync test.
Image may be NSFW.
Clik here to view.
Perspective-corrected image showing ghosting of patterns.
The next step was getting it so that we could find the ball on the test pattern and automate the measurement process. You may notice that in this image, you can see three balls: one at 66ms, one at 100ms, and one at 133ms. This is a result of a few factors: the emissive nature of the display, the camera being slightly out of sync with the TV, and pixel response time.

Through judicious use of image processing, histogram equalization, and thresholding, we were able to get to the point where we could detect the proper ball in the frame and use basic trigonometry to start generating numbers. We only had ~33ms of precision and +/-33ms of accuracy per measurement, but with sufficient sample sizes, the data followed a bell curve around what we felt we could report as an aggregate latency number for a device.
Image may be NSFW.
Clik here to view.
Test frame with location of orb highlighted and sample points overlaid atop the image.
Cinder isn’t perfect. We’ve encountered a lot of hardware issues for the audio pipeline because Cinder expects all parts of the pipeline to work at the same frequency. The default audio frequency on a MacBook Pro is 44.1kHz, unless you hook it up to a display via HDMI, where it changes to 48kHz. Not all webcams support both 44.1kHz and 48kHz natively, and when we can get device audio digitally, it should be (but isn’t always) 48kHz. We’ve got a workaround in place (forcing the output frequency to be the same as the selected input), and hope to have a more robust fix we can commit to the Cinder project around the time we release.

After five months of prototypes, we’re now working on version 1.0 of Electric Eye, and we’re planning on releasing the majority of the code as open source shortly after its completion. We’re adding extra tests, such as mixer latency and audio dropout detection, as well as looking at future applications like motion graphics testing, frame drop detection, frame tear detection, and more.

Our hope is that even if testers aren’t able to use Electric Eye in their work environments, they might be able to get ideas on how to more effectively utilize computer vision or audio processing in their tests to partially or fully automate defect detection, or at a minimum be motivated to try to find new and innovative ways to reduce subjectivity and manual effort in their testing.

John Carmack on Developing the Netflix App for Oculus

Hi, this is Anthony Park, VP of Engineering at Netflix. We've been working with Oculus to develop a Netflix app for Samsung Gear VR. The app includes a Netflix Living Room, allowing members to get the Netflix experience from the comfort of a virtual couch, wherever they bring their Gear VR headset. It's available to Oculus users today. We've been working closely with John Carmack, CTO of Oculus and programmer extraordinaire, to bring our TV user interface to the Gear VR headset. Well, honestly, John did most of the development himself(!), so I've asked him to be a guest blogger today and share his experience with implementing the new app. Here's a sneak peek at the experience, and I'll let John take it from here...

Image may be NSFW.
Clik here to view.

Netflix Living Room on Gear VR


The Netflix Living Room

Despite all the talk of hardcore gamers and abstract metaverses, a lot of people want to watch movies and shows in virtual reality. In fact, during the development of Gear VR, Samsung internally referred to it as the HMT, for "Head Mounted Theater." Current VR headsets can't match a high end real world home theater, but in many conditions the "best seat in the house" may be in the Gear VR that you pull out of your backpack.

Some of us from Oculus had a meeting at Netflix HQ last month, and when things seemed to be going well, I blurted out "Grab an engineer, let's do this tomorrow!"

That was a little bit optimistic, but when Vijay Gondi and Anthony Park came down from Netflix to Dallas the following week, we did get the UI running in VR on the second day, and video playing shortly thereafter.

The plan of attack was to take the Netflix TV codebase and present it on a virtual TV screen in VR. Ideally, the Netflix code would be getting events and drawing surfaces, not even really aware that it wasn't showing up on a normal 2D screen.

I wrote a "VR 2D Shell" application that functioned like a very simplified version of our Oculus Cinema application; the big screen is rendered with our peak-quality TimeWarp layer support, and the environment gets a neat dynamic lighting effect based on the screen contents. Anything we could get into a texture could be put on the screen.

The core Netflix application uses two Android Surfaces – one for the user interface layer, and one for the decoded video layer. To present these in VR I needed to be able to reference them as OpenGL textures, so the process was: create an OpenGL texture ID, use that to initialize a SurfaceTexture object, then use that to initialize a Surface object that could be passed to Netflix.

For the UI surface, this worked great -- when the Netflix code does a swapbuffers, the VR code can have the SurfaceTexture do an update, which will latch the latest image into an EGL external image, which can then be texture mapped onto geometry by the GPU.

The video surface was a little more problematic. To provide smooth playback, the video frames are queued a half second ahead, tagged with a "release time" that the Android window compositor will use to pick the best frame each update. The SurfaceTexture interface that I could access as a normal user program only had an "Update" method that always returned the very latest frame submitted. This meant that the video came out a half second ahead of the audio, and stuttered a lot.

To fix this, I had to make a small change in the Netflix video decoding system so it would call out to my VR code right after it submitted each frame, letting me know that it had submitted something with a particular release time. I could then immediately update the surface texture and copy it out to my own frame queue, storing the release time with it. This is an unfortunate waste of memory, since I am duplicating over a dozen video frames that are also being buffered on the surface, but it gives me the timing control I need.

Initially input was handled with a Bluetooth joypad emulating the LRUD / OK buttons of a remote control, but it was important to be able to control it using just the touchpad on the side of Gear VR. Our preferred VR interface is "gaze and tap", where a cursor floats in front of you in VR, and tapping is like clicking a mouse. For most things, this is better than gamepad control, but not as good as a real mouse, especially if you have to move your head significant amounts. Netflix has support for cursors, but there is the assumption that you can turn it on and off, which we don't really have.

We wound up with some heuristics driving the behavior. I auto-hide the cursor when the movie starts playing, inhibit cursor updates briefly after swipes, and send actions on touch up instead of touch down so you can perform swipes without also triggering touches. It isn't perfect, but it works pretty well.

Image may be NSFW.
Clik here to view.

Layering of the Android Surfaces within the Netflix Living Room


Display

The screens on the Gear VR supported phones are all 2560x1440 resolution, which is split in half to give each eye a 1280x1440 view that covers approximately 90 degrees of your field of view. If you have tried previous Oculus headsets, that is more than twice the pixel density of DK2, and four times the pixel density of DK1. That sounds like a pretty good resolution for videos until you consider that very few people want a TV screen to occupy a 90 degree field of view. Even quite large screens are usually placed far enough away to be about half of that in real life.

The optics in the headset that magnify the image and allow your eyes to focus on it introduce both a significant spatial distortion and chromatic aberration that needs to be corrected. The distortion compresses the pixels together in the center and stretches them out towards the outside, which has the positive effect of giving a somewhat higher effective resolution in the middle where you tend to be looking, but it also means that there is no perfect resolution for content to be presented in. If you size it for the middle, it will need mip maps and waste pixels on the outside. If you size it for the outside, it will be stretched over multiple pixels in the center.

For synthetic environments on mobile, we usually size our 3D renderings close to the outer range, about 1024x1024 pixels per eye, and let it be a little blurrier in the middle, because we care a lot about performance. On high end PC systems, even though the actual headset displays are lower resolution than Gear VR, sometimes higher resolution scenes are rendered to extract the maximum value from the display in the middle, even if the majority of the pixels wind up being blended together in a mip map for display.

The Netflix UI is built around a 1280x720 resolution image. If that was rendered to a giant virtual TV covering 60 degrees of your field of view in the 1024x1024 eye buffer, you would have a very poor quality image as you would only be seeing a quarter of the pixels. If you had mip maps it would be a blurry mess, otherwise all the text would be aliased fizzing in and out as your head made tiny movements each frame.

The technique we use to get around this is to have special code for just the screen part of the view that can directly sample a single textured rectangle after the necessary distortion calculations have been done, and blend that with the conventional eye buffers. These are our "Time Warp Layers". This has limited flexibility, but it gives us the best possible quality for virtual screens (and also the panoramic cube maps in Oculus 360 Photos). If you have a joypad bound to the phone, you can toggle this feature on and off by pressing the start button. It makes an enormous difference for the UI, and is a solid improvement for the video content.

Still, it is drawing a 1280 pixel wide UI over maybe 900 pixels on the screen, so something has to give. Because of the nature of the distortion, the middle of the screen winds up stretching the image slightly, and you can discern every single pixel in the UI. As you get towards the outer edges, and especially the corners, more and more of the UI pixels get blended together. Some of the Netflix UI layout is a little unfortunate for this; small text in the corners is definitely harder to read.

So forget 4K, or even full-HD. 720p HD is the highest resolution video you should even consider playing in a VR headset today.

This is where content protection comes into the picture. Most studios insist that HD content only be played in a secure execution environment to reduce opportunities for piracy. Modern Android systems' video CODECs can decode into special memory buffers that literally can't be read by anything other than the video screen scanning hardware; untrusted software running on the CPU and GPU have no ability to snoop into the buffer and steal the images. This happens at the hardware level, and is much more difficult to circumvent than software protections.

The problem for us is that to draw a virtual TV screen in VR, the GPU fundamentally needs to be able to read the movie surface as a texture. On some of the more recent phone models we have extensions to allow us to move the entire GPU framebuffer into protected memory and then get the ability to read a protected texture, but because we can't write anywhere else, we can't generate mip maps for it. We could get the higher resolution for the center of the screen, but then the periphery would be aliasing, and we lose the dynamic environment lighting effect, which is based on building a mip map of the screen down to 1x1. To top it all off, the user timing queue to get the audio synced up wouldn't be possible.

The reasonable thing to do was just limit the streams to SD resolution – 720x480. That is slightly lower than I would have chosen if the need for a secure execution environment weren't an issue, but not too much. Even at that resolution, the extreme corners are doing a little bit of pixel blending.

Image may be NSFW.
Clik here to view.

Flow diagram for SD video frames to allow composition with VR

In an ideal world, the bitrate / resolution tradeoff would be made slightly differently for VR. On a retina class display, many compression artifacts aren't really visible, but the highly magnified pixels in VR put them much more in your face. There is a hard limit to how much resolution is useful, but every visible compression artifact is correctable with more bitrate.


Power Consumption

For a movie viewing application, power consumption is a much bigger factor than for a short action game. My target was to be able to watch a two hour movie in VR starting at 70% battery. We hit this after quite a bit of optimization, but the VR app still draws over twice as much power as the standard Netflix Android app.

When a modern Android system is playing video, the application is only shuffling the highly compressed video data from the network to the hardware video CODEC, which decompresses it to private buffers, which are then read by the hardware composer block that performs YUV conversion and scaling directly as it feeds it to the display, without ever writing intermediate values to a framebuffer. The GPU may even be completely powered off. This is pretty marvelous – it wasn't too long ago when a PC might use 100x the power to do it all in software.

For VR, in addition to all the work that the standard application is doing, we are rendering stereo 3D scenes with tens of thousands of triangles and many megabytes of textures in each one, and then doing an additional rendering pass to correct for the distortion of the optics.

When I first brought up the system in the most straightforward way with the UI and video layers composited together every frame, the phone overheated to the thermal limit in less than 20 minutes. It was then a process of finding out what work could be avoided with minimal loss in quality.

The bulk of a viewing experience should be pure video. In that case, we only need to mip-map and display a 720x480 image, instead of composing it with the 1280x720 UI. There were no convenient hooks in the Netflix codebase to say when the UI surface was completely transparent, so I read back the bottom 1x1 pixel mip map from the previous frame's UI composition and look at the alpha channel: 0 means the UI was completely transparent, and the movie surface can be drawn by itself. 255 means the UI is solid, and the movie can be ignored. Anything in between means they need to be composited together. This gives the somewhat surprising result that subtitles cause a noticeable increase in power consumption.

I had initially implemented the VR gaze cursor by drawing it into the UI composition surface, which was a useful check on my intersection calculations, but it meant that the UI composition had to happen every single frame, even when the UI was completely static. Moving the gaze cursor back to its own 3D geometry allowed the screen to continue reusing the previous composition when nothing was changing, which is usually more than half of the frames when browsing content.

One of the big features of our VR system is the "Asynchronous Time Warp", where redrawing the screen and distortion correcting in response to your head movement is decoupled from the application's drawing of the 3D world. Ideally, the app draws 60 stereo eye views a second in sync with Time Warp, but if the app fails to deliver a new set of frames then Time Warp will reuse the most recent one it has, re-projecting it based on the latest head tracking information. For looking around in a static environment, this works remarkably well, but it starts to show the limitations when you have smoothly animating objects in view, or your viewpoint moves sideways in front of a surface.

Because the video content is 30 or 24 fps and there is no VR viewpoint movement, I cut the scene update rate to 30 fps during movie playback for a substantial power savings. The screen is still redrawn at 60 fps, so it doesn't feel any choppier when you look around. I go back to 60 fps when the lights come up, because the gaze cursor and UI scrolling animations look significantly worse at 30 fps.

If you really don't care about the VR environment, you can go into a "void theater", where everything is black except the video screen, which obviously saves additional power. You could even go all the way to a face-locked screen with no distortion correction, which would be essentially the same power draw as the normal Netflix application, but it would be ugly and uncomfortable.


A year ago, I had a short list of the top things that I felt Gear VR needed to be successful. One of them was Netflix. It was very rewarding to be able to do this work right before Oculus Connect and make it available to all of our users in such a short timeframe. Plus, I got to watch the entire season of Daredevil from the comfort of my virtual couch. Because testing, of course.

-John

Chaos Engineering Upgraded

Several years ago we introduced a tool called Chaos Monkey. This service pseudo-randomly plucks a server from our production deployment on AWS and kills it. At the time we were met with incredulity and skepticism. Are we crazy? In production?!?

Our reasoning was sound, and the results bore that out. Since we knew that server failures are guaranteed to happen, we wanted those failures to happen during business hours when we were on hand to fix any fallout. We knew that we could rely on engineers to build resilient solutions if we gave them the context to *expect* servers to fail. If we could align our engineers to build services that survive a server failure as a matter of course, then when it accidentally happened it wouldn’t be a big deal. In fact, our members wouldn’t even notice. This proved to be the case.

Image may be NSFW.
Clik here to view.
Chaos Kong

Building on the success of Chaos Monkey, we looked at an extreme case of infrastructure failure. We built Chaos Kong, which doesn’t just kill a server. It kills an entire AWS Region1.

It is very rare that an AWS Region becomes unavailable, but it does happen. This past Sunday (September 20th, 2015) Amazon’s DynamoDB service experienced an availability issue in their US-EAST-1 Region. That instability caused more than 20 additional AWS services that are dependent on DynamoDB to fail. Some of the Internet’s biggest sites and applications were intermittently unavailable during a six- to eight-hour window that day.


Netflix did experience a brief availability blip in the affected Region, but we sidestepped any significant impact because Chaos Kong exercises prepare us for incidents like this. By running experiments on a regular basis that simulate a Regional outage, we were able to identify any systemic weaknesses early and fix them. When US-EAST-1 actually became unavailable, our system was already strong enough to handle a traffic failover.

Below is a chart of our video play metrics during a Chaos Kong exercise. These are three views of the same eight hour window. The top view shows the aggregate metric, while the bottom two show the same metric for the west region and the east region, respectively.

Image may be NSFW.
Clik here to view.
Chaos Kong exercise in progress

In the bottom row, you can clearly see traffic evacuate from the west region. The east region gets a corresponding bump in traffic as it steps up to play the role of savior. During the exercise, most of our attention stays focused on the top row. As long as the aggregate metric follows that relatively smooth trend, we know that our system is resilient to the failover. At the end of the exercise, you see traffic revert to the west region, and the aggregate view shows that our members did not experience an adverse effects. We run Chaos Kong exercises like this on a regular basis, and it gives us confidence that even if an entire region goes down, we can still serve our customers.

ADVANCING THE MODEL

We looked around to see what other engineering practices could benefit from these types of exercises, and we noticed that Chaos meant different things to different people. In order to carry the practice forward, we need a best-practice definition, a model that we can apply across different projects and different departments to make our services more resilient.

We want to capture the value of these exercises in a methodology that we can use to improve our systems and push the state of the art forward. At Netflix we have an extremely complex distributed system (microservice architecture) with hundreds of deploys every day. We don’t want to remove the complexity of the system; we want to thrive on it. We want to continue to accelerate flexibility and rapid development. And with that complexity, flexibility, and rapidity, we still need to have confidence in the resiliency of our system.

To have our cake and eat it too, we set out to develop a new discipline around Chaos. We developed an empirical, systems-based approach which addresses the chaos inherent in distributed systems at scale. This approach specifically builds confidence in the ability of those systems to withstand realistic conditions. We learn about the behavior of a distributed system by observing it in a controlled experiment, and we use those learnings to fortify our systems before any systemic effect can disrupt the quality service that we provide our customers. We call this new discipline Chaos Engineering.

We have published the Principles of Chaos Engineering as a living document, so that other organizations can contribute to the concepts that we outline here.

CHAOS EXPERIMENT

We put these principles into practice. At Netflix we have a microservice architecture. One of our services is called Subscriber, which handles certain user management activities and authentication. It is possible that under some rare or even unknown situation Subscriber will be crippled. This might be due to network errors, under-provisioning of resources, or even by events in downstream services upon which Subscriber depends. When you have a distributed system at scale, sometimes bad things just happen that are outside any person’s control. We want confidence that our service is resilient to situations like this.

We have a steady-state definition: Our metric of interest is customer engagement, which we measure as the number of video plays that start each second. In some experiments we also look at load average and error rate on an upstream service (API). The lines that those metrics draw over time are predictable, and provide a good proxy for the steady-state of the system. We have a hypothesis: We will see no significant impact on our customer engagement over short periods of time on the order of an hour, even when Subscriber is in a degraded state. We have variables: We add latency of 30ms first to 20% then to 50% of traffic from Subscriber to its primary cache. This simulates a situation in which the Subscriber cache is over-stressed and performing poorly. Cache misses increase, which in turn increases load on other parts of the Subscriber service. Then we look for a statistically significant deviation between the variable group and the control group with respect to the system’s steady-state level of customer engagement.

If we find a deviation from steady-state in our variable group, then we have disproved our hypothesis. That would cause us to revisit the fallbacks and dependency configuration for Subscriber. We would undertake a concerted effort to improve the resiliency story around Subscriber and the services that it touches, so that customers can count on our service even when Subscriber is in a degraded state.

If we don’t find any deviation in our variable group, then we feel more confident in our hypothesis. That translates to having more confidence in our service as a whole.

In this specific case, we did see a deviation from steady-state when 30ms latency was added to 50% of the traffic going to this service. We identified a number of steps that we could take, such as decreasing the thread pool count in an upstream service, and subsequent experiments have confirmed the bolstered resiliency of Subscriber.

CONCLUSION

We started Chaos Monkey to build confidence in our highly complex system. We don’t have to simplify or even understand the system to see that over time Chaos Monkey makes the system more resilient. By purposefully introducing realistic production conditions into a controlled run, we can uncover weaknesses before they cause bigger problems. Chaos Engineering makes our system stronger, and gives us the confidence to move quickly in a very complex system.

STAY TUNED

This blog post is part of a series. In the next post on Chaos Engineering, we will take a deeper dive into the Principles of Chaos Engineering and hypothesis building with additional examples from our production experiments. If you have thoughts on Chaos Engineering or how to advance the state of the art in this field, we’d love to hear from you. Feel free to reach out to chaos@netflix.com.

-Chaos Team at Netflix
Ali Basiri, Lorin Hochstein, Abhijit Thosar, Casey Rosenthal


1. Technically, it only simulates killing an AWS Region. For our purposes, simulating this giant infrastructure failure is sufficient, and AWS doesn’t yet provide us with a way of turning off an entire region. ;-)
Viewing all 493 articles
Browse latest View live